isa's short term trading journal

HOIL.L - Entry

Heritage Oil (HOIL.L) held the 255 level on the open, so I went long at 8.57am at 263.73 on the SB prices. Here the trade details:

Trade Details:
Heritage Oil (LSE:HOIL)
Direction: Long

Entry: 263.73
Spread: 1.28 (0.09% ATR Adjusted)

Stop: 247.9
Target 1: 278.01 (2/3rds off)
Target 2: 299.43

Percentage Risk: -6.00% (-1.11% ATR Adjusted)
Target Gain: 13.54% (2.50% ATR Adjusted)

Risk Ratio: 2.26

Daily ATR(200): 14.28 (5.41%)
Weekly ATR(52): 37.99 (14.40%)

ATR Targets
-1x ATR: 249.45
1x ATR: 278.01
1.5x ATR: 285.15
2x ATR: 292.29

Below are the 30 minute entry charts. SB and actual prices chart.
 

Attachments

  • HOIL_30minSB_entry_18-4-11.png
    HOIL_30minSB_entry_18-4-11.png
    16.5 KB · Views: 186
  • HOIL_30min_entry_18-4-11.png
    HOIL_30min_entry_18-4-11.png
    10.4 KB · Views: 185
HOIL.L - Exit

Well what can you do about when a news story like downgrading the US comes out. Unsurprisingly, I'm stopped out of HOIL.L

Closing Trade

HOIL.L (Heritage Oil)
Direction: Long

Entry: 263.73
Exit: 247.90

Percentage Gain: -6.00%

ATR Adjusted Percentage Gain: -1.02%

Trade Grade: F
 
GBPUSD Short entry

Ticker: GBPUSD Rolling Spread
Direction: Short

Entry: 1.65006
Spread: 0.0002 (0.012% ATR Adjusted)

Stop loss: 1.6614
Target: 1.6223

Percentage Risk: -0.68% (-1.01% ATR Adjusted)
Potential Reward: 1.71% (2.54% ATR Adjusted)

Risk Ratio: 2.46

ATR (200 Day): 0.0111 (0.67%)
ATR (52 Week): 0.0337 (2.04%)

ATR Targets:
-1x ATR: 1.6612
1x ATR: 1.6390
1.5x ATR: 1.6334
2x ATR: 1.6279

Entry Reason
Looks over extended on the daily chart. It touched the edge of the 3ATR channel last Thursday and hasn't been able to make a new high. So I think it's going to pullback to value around 1.6350

Here's my charts
 

Attachments

  • GBPUSD_30min_25-4-11.png
    GBPUSD_30min_25-4-11.png
    25 KB · Views: 178
  • GBPUSD_entry_25-4-11.png
    GBPUSD_entry_25-4-11.png
    17.4 KB · Views: 185
  • GBPUSD_daily_25-4-11.png
    GBPUSD_daily_25-4-11.png
    29.2 KB · Views: 185
GBPUSD Short exit

I tightened my stop loss on this to just below my breakeven as the price action looked to be moving back to the bull side again. So I was was stopped out fairly soon after as the Pound broke above the 1.65 level. Here's the closing trade details:

Closing Trade

GBPUSD (FX:GBPUSD)
Direction: Short

Entry: 1.65006
Exit: 1.65016

Trade length: 24 hours

Percentage Loss: -0.01% (-0.01% ATR Adjusted)

Trade Grade: D

Attached is the charts of the trade
 

Attachments

  • GBPUSD_30min_exit_26-4-11.png
    GBPUSD_30min_exit_26-4-11.png
    18.6 KB · Views: 176
  • GBPUSD_30min_PnF_26-4-11.png
    GBPUSD_30min_PnF_26-4-11.png
    27.4 KB · Views: 180
BT Group - Entry

My buy stop order at 197.4 for BT Group was hit at 10.16am

Here's the full trade details:

Trade Details:
BT Group (BT-A.L)
Direction: Long

Entry: 197.4
Spread: 0.59 (0.16% ATR Adjusted)

Stop: 190.60
Target: 206.9

Percentage Risk: -3.44% (-1.79% ATR Adjusted)
Target Gain: 4.81% (2.50% ATR Adjusted)

Risk Ratio: 1.40

Daily ATR(200): 3.8 (1.93%)
Weekly ATR(52): 9.31 (4.72%)

ATR Targets
-1x ATR: 193.60
1x ATR: 201.20
1.5x ATR: 203.10
2x ATR: 205

Lets see if this breakout in BT from the range can gain some momentum and start a new rally.
 

Attachments

  • BT_Daily_PnF_4-5-11.png
    BT_Daily_PnF_4-5-11.png
    27.1 KB · Views: 180
  • BT_Daily_4-5-11.png
    BT_Daily_4-5-11.png
    18.2 KB · Views: 176
  • BT_30min_4-5-11.png
    BT_30min_4-5-11.png
    17.8 KB · Views: 187
Last edited:
SP 500 Long Entry – Jun 11 Spread

The S&P 500 is testing the recent breakout level and has pulled back to horizontal support and the fast moving averages. The 30 minute chart gave me a buy confirmed candlestick pattern, so I'm going long here with a small initial position which I'll add to if the support holds.

Trade Details:
SP 500 Jun 11
Direction: Long

Entry: 1342.4
Spread: 0.6 (0.04% ATR Adjusted)

Stop: 1294.9
Target: 1394

Percentage Risk: -3.54% (-3.48% ATR Adjusted)
Target Gain: 3.84% (3.78% ATR Adjusted)

Risk Ratio: 1.09

Daily ATR(200): 13.66 (1.02%)
Weekly ATR(52): 39 (2.91%)

ATR Targets
-1x ATR: 1328.74
1x ATR: 1356.06
1.5x ATR: 1362.89
2x ATR: 1369.72

Below are the entry charts
 

Attachments

  • SP500_30min_4-5-11.png
    SP500_30min_4-5-11.png
    17 KB · Views: 173
  • SP500_Daily_4-5-11.png
    SP500_Daily_4-5-11.png
    15.6 KB · Views: 194
  • SharpChartv05.png
    SharpChartv05.png
    25.4 KB · Views: 173
Seems to be holding so far.

Quite a large stop distance though i.m.h.o. ;-)

I only put on a third of my normal position size to compensate for that as I suck at timing the S&P so I'm giving myself a bit more wiggle room than normal by putting it below the 1300 level as it would need to get really bearish to get below 1300 IMO.

If we get a good move up from here I'll bring my stop up and add to the position as I want to have a core position in the S&P 500 that I hold for a bit longer than normal.
 
Last edited:
The S&P 500 seems to have put in a short term swing low. So I'm moving my stop up to just over 1x ATR risk which is my normal risk level as if it can't make it back above the downtrend line then it could sell off again quickly.
 
SP 500 Long Exit – Jun 11 Spread

My stop loss was hit on the S&P 500 position.

Closing Trade

SP 500 June Spread
Direction: Long

Entry: 1342.4
Exit: 1325.90

Percentage Gain: -1.23%

ATR Adjusted Percentage Gain: -1.21%

Trade Grade: F
 
VIX - Entry

I've opened a long position in the VIX at 16.68 for some account protection as I think even though the market is rallying today, that the sentiment has changed and the market will resume the sell off over the next few weeks. So I'm buying the VIX protection while it's cheap today.
 
Palladium Short

Trade

Palladium (June Contract)

Sector: Metals

Order Type: Warehoused

Direction: Short

Warehoused Entry: Will manually enter during the week.

Initial Stop loss: 75.6
Initial Target: 55

ATR (200 Day): 1.7 (2.34%)
ATR (52 Week): 4.58 (6.32%)

ATR Targets: - Based on estimate entry point of 72.5
-1x ATR: 74.20
1x ATR: 70.80
1.5x ATR: 69.95
2x ATR: 69.10

Entry Reason
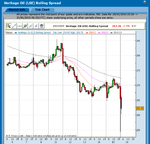
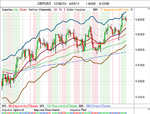
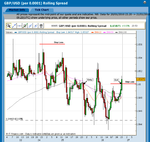
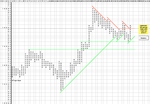
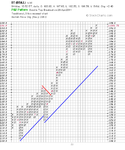
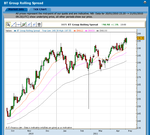
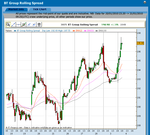
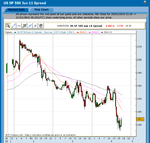
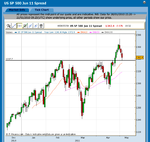
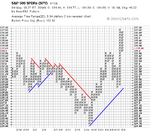
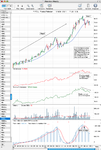
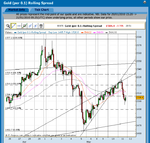
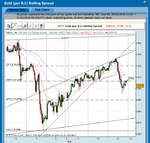
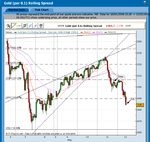
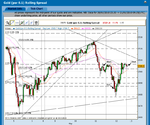
I've been looking at the weekly charts mostly this week and I've become more and more bearish on the general market and I think a medium term top could be in as there were various blow off moves in different areas of the market especially the dollar. So I've been looking for potential shorts this weekend and have been using Weinstein's stage analysis to look for good candidates moving into a stage 4 decline. One that stood out to me was Palladium as since the Japan crisis it has been forming a stage 3 top pattern and not participating in the metals blow off top. This is partly due to the fact that it has stealthily outperformed Silver over the last 2 years with a massive 365% gain, but it doesn't get any attention in the press, and also because Silver is nearly always the last to move in a metals bull run.

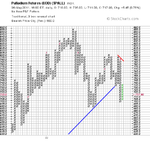
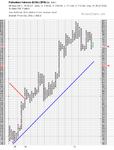
This seems like a hugely one sided trade at the moment as since the launch of the US based ETF PALL in January 2010 it has basically gone straight up. So I think there's a good possibility for a big decline in this at least back to the breakout point at 55 IMO. So I'm going to try a ride this one all through a stage 4 decline after a possible initial bounce early in the week.

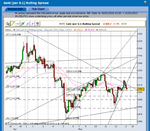
Attached is my charts
 

Attachments

  • PALL_Weekly_6-5-11.png
    PALL_Weekly_6-5-11.png
    59.1 KB · Views: 174
  • PALL_Daily5_PnF_6-5-11.png
    PALL_Daily5_PnF_6-5-11.png
    22 KB · Views: 168
  • PALL_Daily10_PnF_6-5-11.png
    PALL_Daily10_PnF_6-5-11.png
    35.8 KB · Views: 161
I got an entry in the Palladium short that I set out above at the bid price of 730.98 at 1:59pm today. I'm planning on holding this one hopefully down to the 550 level. So lets see if it can get there over the next month or so.
 
I'm short Gold now as well as Palladium which is doing very well so far. I entered gold at 1504.5 at the pullback to the broken through 1506 support level. I'm hoping for this to retest the 5th May low. Attached is the charts.
 

Attachments

  • Gold_2hr_11-5-11_short_entry.png
    Gold_2hr_11-5-11_short_entry.png
    20.7 KB · Views: 188
  • Gold_1hr_11-5-11_short.png
    Gold_1hr_11-5-11_short.png
    20.8 KB · Views: 180
Re: Gold Trade

I'm short Gold now as well as Palladium which is doing very well so far. I entered gold at 1504.5 at the pullback to the broken through 1506 support level. I'm hoping for this to retest the 5th May low. Attached is the charts.

I've just exited my Gold short from last night as it was an additional position to my Palladium short which I'm most bearish on. Gold has better relative strength of the metals so it could bounce as it has run down quickly overnight. So I have taken a quick profit on this one and will leave my palladium short on hopefully for the next month or so. Here's the closing trade details:

Closing Trade

Gold Rolling Spread
Direction: Short

Entry: 1504.5
Exit: 1485.7

Percentage Gain: 1.27%

ATR Adjusted Percentage Gain: 1.02%

Trade Grade: B

Attached is the chart of the whole trade
 

Attachments

  • Gold_1hr_12-5-11_short_exit.png
    Gold_1hr_12-5-11_short_exit.png
    20.8 KB · Views: 188
Gold is struggling at last nights resistance level again around the 1506 area and a few of currencies are struggling at support levels as well so I'm shorting gold again for a test back down to the trend line. Entry at 1504.5
 

Attachments

  • Gold_1hr_12-5-11_short_entry.png
    Gold_1hr_12-5-11_short_entry.png
    23 KB · Views: 179
Gold is struggling at last nights resistance level again around the 1506 area and a few of currencies are struggling at support levels as well so I'm shorting gold again for a test back down to the trend line. Entry at 1504.5

Gold didn't get any downside follow through and bounced at the moving averages overnight and I've been stopped out for a small loss at 1508.9
 
I got a re-entry on Gold at 1504 short a few hours ago because the dollar looks strong IMO.

Here's my entry chart
 

Attachments

  • Picture 56.png
    Picture 56.png
    59.6 KB · Views: 175
Top