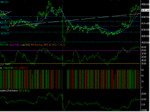
Anybody came across these Fib techniques?? Some more to add to the toolbox.
http://www.tradingday.com/c/tatuto/fivefibonaccitricks.html
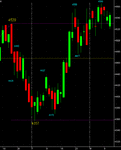
The morning gap technique marked an intraday reversal point pretty much bag on the head at 4,536
http://www.tradingday.com/c/tatuto/fivefibonaccitricks.html
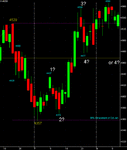
The morning gap technique marked an intraday reversal point pretty much bag on the head at 4,536