You are using an out of date browser. It may not display this or other websites correctly.
You should upgrade or use an alternative browser.
You should upgrade or use an alternative browser.
tradesmart
Experienced member
- Messages
- 1,286
- Likes
- 22
Crude at over $42 and the market powers into green at the close..….perhaps they’re anticipating good news from the OPEC meeting on Thursday…..... 😕
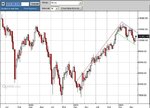
A bullish performance in the face of adversity that could put channel resistance at 10400 ish within reach.......... ?!
A bullish performance in the face of adversity that could put channel resistance at 10400 ish within reach.......... ?!
Attachments
tradesmart
Experienced member
- Messages
- 1,286
- Likes
- 22
The market achieves the ludicrous on a serial basis Mom, so anything is possible imho…….!….. :cheesy:
I have 350 as a target tops, based on current strength... Temporarily in Bull mode, but for how long. Won't take much for the bears to take a hold, I feel. The breakout has held above support on the old up channel resistance and that must be good for the bulls. As TS says, how come we get this when Oil is in such a bad way? One could be tempted into thinking tomorrow should be good, given the strength of the last hour or so's move....
If you can see the thin triangle made over the last few days, we got a false break to the downside today, with a recovery to just above the resistance line. This gives a target of 275 ish. That means breaking 232 and 264, so it should be an easy day to track....
If you can see the thin triangle made over the last few days, we got a false break to the downside today, with a recovery to just above the resistance line. This gives a target of 275 ish. That means breaking 232 and 264, so it should be an easy day to track....
Attachments
Interesting day... with ND setting in across from Friday, even though there was a small gap down. Even more interesting into the close with multi targets. By the time T1 was met , it was easy to ride on the measured moves to the top. No ND out, but you should have got out as 210 dropped into the close.... A close above 215 would have been conclusive, but I guess that was one step too far...
Attachments
Bigbusiness
Experienced member
- Messages
- 1,408
- Likes
- 23
Prior to today the Dow had closed positive on June 1st 12 of the last 13 times. This is according to my stats, that might be wrong as I am using free data but it does agree with my data from recent years. Might have something to do with today or it could be that I haven't looked at enough data for it to be significant.
Bigbusiness said:Prior to today the Dow had closed positive on June 1st 12 of the last 13 times. This is according to my stats, that might be wrong as I am using free data but it does agree with my data from recent years. Might have something to do with today or it could be that I haven't looked at enough data for it to be significant.
Indeed day after memorial day is a "seasonally" strong day for the NY markets. Buying on 25May and closing position on/around 6thJune has been a profitable trade 13 of last 15yrs (source MRCI).
May I ask where you get your data?
Bigbusiness
Experienced member
- Messages
- 1,408
- Likes
- 23
I found the data in a yahoo group. It is the file '1897 - 2003-10-01.zip' from this page (you will have to sign up for free if you don't have a user name and password) http://finance.groups.yahoo.com/group/Time-Price-Research-I/files/Data/
I have found yahoo groups are full of data and ebooks that would have cost me a lot of money to buy. It takes a while to search them but it is worth the effort.
I have found yahoo groups are full of data and ebooks that would have cost me a lot of money to buy. It takes a while to search them but it is worth the effort.
what happens today is anyones guess, yesterday the good econ/news over rode any neg/oil news
the market itself wants to be in a buullish mode, and any good news from OPEC tomorrow will confirm.
After looking at the above charts imo the med/term looks like 10120- 10220, longer/term 9790-10400.
the market itself wants to be in a buullish mode, and any good news from OPEC tomorrow will confirm.
After looking at the above charts imo the med/term looks like 10120- 10220, longer/term 9790-10400.
One Eyed Shark
Well-known member
- Messages
- 257
- Likes
- 13
I trade off my indicator and this is what it tells me on the daily chart....................
We are at a top, could see a close nearer 250 but then we are heading back down........
It is not always right but it is correct more often than I am 😀
I never trade off the daily, only very short term
Will I be a buyer today ? Probably
Will I be profitable ? Depends on how many times I take notice of what is happening on the screen or whether I think I know better :cheesy:
One Eyed Shark
Well-known member
- Messages
- 257
- Likes
- 13
EJ
I usually take 10-20 trades a day and hold for seconds going into minutes, I will often sell the pullback in an uptrend and vice versa, agree that a higher risk exists to the upside , but as and when a pattern prints long or short I take it.
No worries on being a buyer, tighter stops , but will not discount long trades
From Yesterday...
I like it when a plan comes together. Better still as the price pulled back to the break line for support. No clear target of 350 , though. Current target is 305 and 350 may follow.
You can see the thin triangle made over the last few days, we got a false break to the downside today, with a recovery to just above the resistance line. This gives a target of 275 ish. That means breaking 232 and 264, so it should be an easy day to track....
I like it when a plan comes together. Better still as the price pulled back to the break line for support. No clear target of 350 , though. Current target is 305 and 350 may follow.
Attachments
Nice easy day, sort of. Taking either the PD off 200 or the triangle break and pullback at 210 for the extra cautious...
The long open triangle gave a target of 240 that appeared to stumble around the 32's.That soon recovered with only 8 point pullback, to provide a target of T1 at 253. If you missed the top, there was another out 5 points down from that at 280... and a nice short/reversal..... that was short lived as the price bounced off 264. Two more opportunities to get out at 60 and 54 as PD started to set in again. Looks good for bulls again tomorrow... Going short off that top or long off the 64 bounce would have ended neutral. I did both.....
The long open triangle gave a target of 240 that appeared to stumble around the 32's.That soon recovered with only 8 point pullback, to provide a target of T1 at 253. If you missed the top, there was another out 5 points down from that at 280... and a nice short/reversal..... that was short lived as the price bounced off 264. Two more opportunities to get out at 60 and 54 as PD started to set in again. Looks good for bulls again tomorrow... Going short off that top or long off the 64 bounce would have ended neutral. I did both.....
Attachments
Similar threads
- Replies
- 135
- Views
- 20K