You are using an out of date browser. It may not display this or other websites correctly.
You should upgrade or use an alternative browser.
You should upgrade or use an alternative browser.
Are we still watching it?
Been a long time since I wrote on arm last time. Not that I lost interest though, it's still one of the most popular shares discussed in the chatroom...
ARM has been one of the first to break the doom and gloom sentiment deepened by the Sept 11th incident..it took arm less than 2 weeks to start recovering and forming an uptrend which has continued ever since...taking the price from around 200 to 360, almost doubling it...
So where is it going from here? that's a question that needs to be answered by arm followers before getting to exited and carried away, as I said in earlier posts arm is a terrific share with strong followers but can hurt either way if not carefully traded...
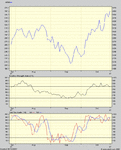
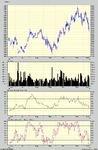
Having looked at 5d intraday chart I can see arm failing to break through 368/9 3 times, this caused the price to retrace to 340 only to retry on +ve tech sentiment inspired by bullish Nas, but arm still has so far failed to break through 370 (rounding up the figure) resistance, this suggesting to me that arm has either to break through that level or retrace to around 310 before starting another uptrend...on the other hand both RSI and stochastics have been at oversold area for some time and are bound retrace from there sooner or later...note that RSI forming a H&S and ticking down on -ve price/rsi divergence
Now let's see what Steve and SirY2K say about this 🙂
Riz
Been a long time since I wrote on arm last time. Not that I lost interest though, it's still one of the most popular shares discussed in the chatroom...
ARM has been one of the first to break the doom and gloom sentiment deepened by the Sept 11th incident..it took arm less than 2 weeks to start recovering and forming an uptrend which has continued ever since...taking the price from around 200 to 360, almost doubling it...
So where is it going from here? that's a question that needs to be answered by arm followers before getting to exited and carried away, as I said in earlier posts arm is a terrific share with strong followers but can hurt either way if not carefully traded...
Having looked at 5d intraday chart I can see arm failing to break through 368/9 3 times, this caused the price to retrace to 340 only to retry on +ve tech sentiment inspired by bullish Nas, but arm still has so far failed to break through 370 (rounding up the figure) resistance, this suggesting to me that arm has either to break through that level or retrace to around 310 before starting another uptrend...on the other hand both RSI and stochastics have been at oversold area for some time and are bound retrace from there sooner or later...note that RSI forming a H&S and ticking down on -ve price/rsi divergence
Now let's see what Steve and SirY2K say about this 🙂
Riz
Attachments
Last edited:
Looks like the chart and indicators were giving right signals down today -15.5 to 345, with the -ve senitiment started in the US 310 is not so unlikely...missed to short it today as by the time I went online it was already down enough for the day, hope anyone else enjoyed the ride down...
Riz
Riz
So where from here, back to 415 or so where it formed 2 top in May or pulling back...got to extend the time scale to have a better idea about this...on 6 month chart ARM looking quite good now...having broken through all major resistance levels on the way up...RSI stopped ticking down and back ticking up heading back over 70 line, stochastics look like they like hoverin around 80 lines ignoring o/b signals, ARM certainly eager to lift its trade range to 350-above 400 area...no doubt it will have a go at 400 if it doesnt retrace below 350 soon...as usual ARM is a terrific trade
Riz
Riz
Attachments
back to arm
It's been a long time since I my last post on arm, been busy watching advertising and publishers recently...after hovering above and below 400, ARM started falling all the way down to 320 which is a major sup/res level on Nasdaq's recent weak performance and concerns on senior management change....
Only yesterday news that ARM has emerged as the winner on the multi-million dollar lawsuit against PicoTurbo which has been marketing ARM-compatible products in breach of its US patents may soon make senior management concerns forgotten...
With PicoTurbo acknowledging the enforceability of ARM's patents and agreeing to work with its customers to move them over to official ARM designs, ARM is proving that it can protect its intellectual property which has been one of the major concern...
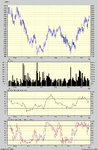
Chartwise price is bang on a major support level and interestingly forming a bullish harami candle pattern right there....RSI though broken down the descending triangle formed recently is hitting the 30 line which has been a strong support line...stochastics oversold and K just started ticking up...
Overall unless we have serious negative news from over the pond on techs both news and chart are suggesting that ARM is highly likely to bounce from the current level as off next week...I've just put them on my long watch list for next week...
Riz
It's been a long time since I my last post on arm, been busy watching advertising and publishers recently...after hovering above and below 400, ARM started falling all the way down to 320 which is a major sup/res level on Nasdaq's recent weak performance and concerns on senior management change....
Only yesterday news that ARM has emerged as the winner on the multi-million dollar lawsuit against PicoTurbo which has been marketing ARM-compatible products in breach of its US patents may soon make senior management concerns forgotten...
With PicoTurbo acknowledging the enforceability of ARM's patents and agreeing to work with its customers to move them over to official ARM designs, ARM is proving that it can protect its intellectual property which has been one of the major concern...
Chartwise price is bang on a major support level and interestingly forming a bullish harami candle pattern right there....RSI though broken down the descending triangle formed recently is hitting the 30 line which has been a strong support line...stochastics oversold and K just started ticking up...
Overall unless we have serious negative news from over the pond on techs both news and chart are suggesting that ARM is highly likely to bounce from the current level as off next week...I've just put them on my long watch list for next week...
Riz
Last edited:
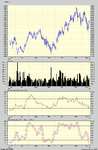
We got further rises too..up +18.75 (5.3%) to 371.5 today...
So what level is arm heading for? Obviously arm is eyeing 400, only may have retracements on the way, over +50 in 2 days...
Interesting to see how the rsi bounced right at 30 line as expected...
Updating the chart for comparison...
Riz
So what level is arm heading for? Obviously arm is eyeing 400, only may have retracements on the way, over +50 in 2 days...
Interesting to see how the rsi bounced right at 30 line as expected...
Updating the chart for comparison...
Riz
Attachments
From a slightly longer time perspective than many seem to hold around here, ARM looks very dodgy.
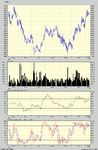
Here is your chart with some of my squiggles on it.

The Bull Trend (3)has been broken, along with the immediate support at 370. This has led to a test of the major support area at 320/330 which, so far, has held.
The failure to make new highs or to break back above 420 allowed us to draw in a Phase 1 (Disbelief) long term trend (1). We then move into a more realistic Phase 2 (Reality) bear trend (2), having had a bit of Phase 3 (OmiGodHelp) trend - the unsustainable drops or rises that lead to retracement.
The current retracement has moved back to retest the old support (370) which has now become resistance (Dead Man's Knock) and confirm a more sensible trend angle. I would expect to see a continuance under this trendline to at least retest the 330/20 area, and perhaps beyond to retest the base at 190/200 - ugly stuff.
On the positive side, the only thing that would convince me to go long ARM (depending on yr time horizon) would be a break above 420. I would rather be short than either flat or long, with a stop ready to go on the break of the major trend (1) - so currently a close above 410, but again, it depends on your risk/reward/time ratio as to how you would personally trade this.
But, for me, ARM looks like a sick puppy at the moment.
Here is your chart with some of my squiggles on it.
The Bull Trend (3)has been broken, along with the immediate support at 370. This has led to a test of the major support area at 320/330 which, so far, has held.
The failure to make new highs or to break back above 420 allowed us to draw in a Phase 1 (Disbelief) long term trend (1). We then move into a more realistic Phase 2 (Reality) bear trend (2), having had a bit of Phase 3 (OmiGodHelp) trend - the unsustainable drops or rises that lead to retracement.
The current retracement has moved back to retest the old support (370) which has now become resistance (Dead Man's Knock) and confirm a more sensible trend angle. I would expect to see a continuance under this trendline to at least retest the 330/20 area, and perhaps beyond to retest the base at 190/200 - ugly stuff.
On the positive side, the only thing that would convince me to go long ARM (depending on yr time horizon) would be a break above 420. I would rather be short than either flat or long, with a stop ready to go on the break of the major trend (1) - so currently a close above 410, but again, it depends on your risk/reward/time ratio as to how you would personally trade this.
But, for me, ARM looks like a sick puppy at the moment.
Last edited:
Naz
Experienced member
- Messages
- 1,391
- Likes
- 25
Arm has been following the $sox quite well since october and closely mirrors BRCM in that period of time.
I personaly would want to watch what the sector was doing ($sox) and the tier 1 Generals to give me a lead.Then you know Arm will probably play catch up with them.
I personaly would want to watch what the sector was doing ($sox) and the tier 1 Generals to give me a lead.Then you know Arm will probably play catch up with them.
Naz
Experienced member
- Messages
- 1,391
- Likes
- 25
The great thing about the market is that every one has a different point of view.
I myself have always looked at the sector a stock is trading in to be a reasonable indication of what might befall my stock.Like today the $sox fell because of bad news in the sector.
"Chip stocks led the decline. The Philadelphia Semiconductor Index ($SOX) dropped by 3.4 percent, with earnings warnings from Motorola (MOT) and Micron Technology (MU) being among the biggest drags."
Bad news had also come from TQNT in after hours trading on tuesday evening.
It therefore was no suprise that ARM fell about 5% on the day.
But i also agree that if you look at a graph you can always find reasons for a reversal.As in so many cases maybe its worth putting different ideas together rather than loking at one idea only.
Last edited:
Hi Naz,
I completely agree with you that it is worth looking at a sector, or an index etc as a rough guide as to what is going on - 'The Big Picture' if you will, but to trade the product in question, you have to trade that product alone. They don't all follow the sector or index trends per se, and certainly there can be a time lag - often enough to cause fiscal pain.
See Nasdaq and Ebay or MKS and FTSE100 as classic examples. (MKS both up and down).
.. and if you trade off the chart (not graph please! 😉 ), then the sectors become irrelevant, as does the news etc - but thats probably for another thread 🙂
What you guys on about?
We're day/swing trading arm here and making the calls accordingly, having learnt enough to figure out shares like ARM are too risky to bank long term investments on...
Call was for a move and we got over 50, then retracement expected and we got 20, over all 70 points potential in 3 days, (if I get 1/2 of this I dont care if it looks a sick or a healthy puppy) why should I wait for your 420 and risk going back to below 400 as arm is in the habit of doing it...
Riz
Riz said:What you guys on about?
We're day/swing trading arm here and making the calls accordingly, having learnt enough to figure out shares like ARM are too risky to bank long term investments on...
Riz
Ermm Riz,
READ THE POST - it quite clearly states that it refers to a longer time period than most use around here.
However, even day traders make more money trading in the direction of the prevailing trend.
ARM is no more risky than any other share when it comes to a 'long term" investment - it just depends how you define "long term" 🙂 and react to the price action. In the entire history of ARM there have only been 4 trades, 2 long and 2 short.
Anyone trading these 'longer term' positions, even as an overriding hedge against day trading, will have made considerable profits without having to stare at a screen trying to 'nickel and dime' the market.