Wallstreet1928 Analysis & live calls on FTSE,DAX,S&P...aimed to help New traders

Status
Not open for further replies.
Bizarre goings on today...gold up and down early on in a strange manner...so too the DOW. Seems as though the ranges of movement are getting bigger, indicating big moves of liquidity obviously.

Difficult to trades these markets, understatement!
 
the action in the market in the last 15 minutes is why i love being a day trader/scalper

what a crazy move

down to 792 ....then back up to 811 !!

crazy.........
 
2 factors

1. fall in demand for exports - IT sector gets battered along with negative IBM data

2. disappointing Treasury note auction raised concerns of flagging foreign interest in U.S. government debt
"Our auction didn't go as smoothly as the last one did, so that's basically telling people maybe it's the start of China and Japan not as interested in our bonds as they were." said Dave Rovelli, managing director of U.S. equity trading at Canaccord Adams, in New York.

If China in the future doesn't want U.S. government bonds, "that would be very, very bad for our economy, especially since with Obama's new budget he needs trillions of dollars," Rovelli said.


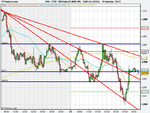
but the real reason as we all know is TA

TA rocks.............
Thanks for that...
 
clueless , flabbergasted, puzzled and dazed is the best way to describe it

I just don't understand what is happening here

we seem to be stuck in this range and break out either way causes the market to pull back within the range

1 week, 1 hr

red horizontal line is still key for me but with the fall below being negated after hours, the bias is on the upside

scenario 1 - short if falls below red horizontal line

scenario 2 - long if market passes 3940 region convincingly


2 day , 10 min chart

I feel scared to short this market after the powerful reversal we just witnessed in the US market .................buyers are in control here!!

so neutral posture from the open

scenario 1 - possible risky scalp for 20-25 points up to 3940 after passing 200 MA and red resistance line above 3909 & 3914....

but ideal long would be if we pass through 3940 convincingly

scenario 2 - short if falls below 3960 convincingly , coinciding with analysis on 1 week chart

oh well lets see what tomorrow brings

just watching new Zealand V India and its like De Javu........
new Zealand 64/3 batting first
 

Attachments

  • 23.07.png
    23.07.png
    14.1 KB · Views: 135
  • 23.12.png
    23.12.png
    22.8 KB · Views: 135
Last edited:
hi all,

homework says flat on indices.

I cannot see any opportunites either way. if i go long it would smash off 3940.

If I short it would ramp upto 4000.

The action overnight has put on 50 points!

i was short... Ouch. big target to reclaim to get B/E for the week now.

so flat until an opportunity hits me in the face. I was saying to a friend it might be worth not trading until this is all taken a direction. its like a yoyo round here!
 
wow! what happened there? i missed all that action during 5pm to 8pm last night. Looks like Im going to have to do the night shift instead :)
 
i am short the FTSE @ 3934 with a tight stop @ 3950 (just in case it breaks above resisitance at 3940)
 
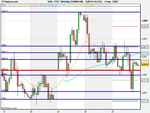
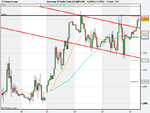
closed @3924 for 10 points scalp


Good morning my friends

nice scalp there BW81, just what I like to see

scalp for breakfast, scalp for lunch and scalp for supper..haha!!

its a day traders market, the whipsaws can send you to the cleaners for all those swing traders ..............take last night as an example
 
Dax chart

2 day 10 min

any break above the blue line(coincides with R2 pivot) and I will go long

if it falls blow red trend line the i will short

until then a neutral posture
 

Attachments

  • 26  7.23.png
    26 7.23.png
    15.4 KB · Views: 135
bw - what broker do you use?

cmc is currently a 4 tick spread and iii/finspreads/city index is 6!

i use both IG and CMC, i prefer the trading platform at IG

IG also has the best 'FREE' charts (when the they dont go down like they did the other day)
 
I am short FTSE 3906 ...stop loss 3936

Its looking weak at open for me and S&P failed to get past 823 again
 
Im looking at the overall picture on the DAILY FTSE and its still in the major downtrend of June 2008 touching highs at 20th may, 1st sept, and 6th jan. I also have a major horizontal resistance at 4038 which coincides with the downtrend line. so if we do trade up today above 3940 i think there will be some good shorting at around 4038.
 

Attachments

  • ftsedaily.jpg
    ftsedaily.jpg
    149.3 KB · Views: 124
Status
Not open for further replies.
Top