Trading the ES (E mini) December 2003

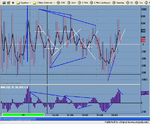
Stoploss - no particular divs on main crosses, sox shining a bit, bix lagging a bit - no-trend day.

Buy LP set-up is still valid. if u intend to just scalp - I'd say either u fix 1.5 pts and jump out no matter what, or c how 40ema/5min is resolved
 
Hampy,

sorry mate I did not get back to u earlier.

Ideally on a no-trend day u want to buy LP or better on a tick pos div and sell UP or better on a tick neg div. Obviously if u r L from LP, futures get to UP and there r no neg divs u want to let it run - since u don't want to miss out on a potential surge.

On scalping I am quite rigid - 1.5 trgt with 1.5 stoploss.

On a trend day all yr scalps will be limited by 40ema/5min which is also a good point to jump on the trend.

I agree with u that sometimes a chiselled divergence dies out after a cupl of pts, whilst some weaker divergencies yield monstrous gains. As a rule I'd say I stay in trade until next tick div sequence. What I find most important IS THAT DEPENDING ON THE MRKT STRENGTH (internals, key avrgs etc.) AND ENTER POINT WITH REGARD TO 1st HR PIVOTS - U NEED TO BE CLEAR WHETHER U WANT THIS TO BE A SWING TRADE OR A SCALP. clear with yrself I mean :) if I enter a scalp I am out at 1.5 no matter what. If it is an intraday swing I stay till next tick div.

hope it answers yr Q.
 
China
I'm using Linnsoft's IRT

www.linnsoft.com
(colours are what I like, you can do what you want).

The stochstic buy signal I use is SLOWD>SLOWD.1 and SLOWD.1<SLOWD.2 where SLOWD is slow%D

BUT I also only use it at extremes..ie. 20/80 ish

I don't use divergences.. but I also use support/resistance, pivots(yellow horizontal lines) and 1st Hour hi/los (blue/red horizontal lines) plus over /under 9ema (the red/green circles are the 9ema high /9ema/lows)
 
thx madasafish :)

I was curious, coz if I remember it right u can trade either on the fast/slow cross or on up/downslope of slow with stochastics. I am meaning fast and slow within one setting, say 38,9,9 - not btwn faster and slower settings.
 
Stoploss
That's a great idea regarding other points of interest. If you need someone to edit and re-post as RR did before then I'd be happy to do it. I know RR ran out of time as I read his earlier post. I would however need some help as I'm not a computer expert!
Anyway it was just a thought as I reckon it'd be a great way for me to study too! I'm away next week though!?
Cheers
Q
 
China

So today, we had six entries, three longs and three shorts. As we are trading below the key averages and upper pivot, the longs will all be1.5 scalps and you will let the shorts run for as long as we can.

Quercus

I think what we need to do is for everyone to look at the various areas within these threads and pull out what is most important. Then maybe, as China said, create a tutorial. As I have been really involved in all these threads maybe the honour of doing this should fall on the shoulders of a relative new comer. They can then look at what has been posted with fresh eyes.

As for compiling the monthly thread, I do not mind sharing this task out.

So, we need some volunteers to show their hands.
Andy
 
stoploss - may i correct u mate? All below key avrgs, neutral-ish internals at all time pivots - IT IS A NON-TREND DAY! We expect to buy LP (first pivot tested) on tick pos div and sell UP on tick neg div later on! per system it is 1 L and 1 S, the rest r scalps.
 
I shud've said - NON-TREND DAY WITH NO PARTICULAR DIVS ACROSS INDICES in my previous post - my apologies. If it was a non-trend day with, say, neg divs across indices, we'd be looking to buy not LP, but 2-3 pts below LP on a tick pos div
 
Mate

I will post a chart in a mo. Watching the footy and getting a bit distracted. Also, think I maybe usuing the wrong terms which doesn't help.
 
The Tick 10/12

China

This is how I saw todays Tick. A combination of your divergence and my trend line and peak and trough analysis.

Posting ES in a minute.
 

Attachments

  • dow 5min200.png
    dow 5min200.png
    118.2 KB · Views: 212
China,
Thanks for the reply.
Another gem to print off and re-read until I understand it.
Looking forward to practising in real time soon, live chart package finally working today.
cheers,
hampy
 
hampy

luvly example - a S today at 12:15 on more than doubtful tick neg div without any preceeding macd of tick div vs. tick - was the biggest earner of the day. More to the point, it hap'd below UP. In hindsight we of coz "explain" it by 40 ema/5min being resistance of the day - BUT THAT IS FITTING CURVES - as 40 ema is not a primary indicator on a non-trend day.

Of coz when u rev to S at 12:15 u HAD to view the trade as a SCALP and place a trgt of 1.5 pts. It is all about odds management. The odds of that being a scalp and ES properly shooting up to Upper Pivot (where we would "properly" short per sys) were HIGHER than the odds of what really happened. Personally, no regrets on taking only 1.5 pts on that trade :)
 
ES 10/12

Hello mate

I hope this does not hurt your eyes mate. I have input your MAs and that thick yellow line is the pivot derived from the sterioline calculator.

I have also labelled all the swings. Could you do me a favour and label what you call the upper and lower pivots and also what points targets you should go for on each entry. I think this would be an interesting exercise.

Cheers
Andy
 

Attachments

  • dow 5min201.png
    dow 5min201.png
    140.6 KB · Views: 399
and here's my 2 minute chart for the day.. No thinking required at all really...
 

Attachments

  • spoos 10dec.gif
    spoos 10dec.gif
    42.9 KB · Views: 397
10-12

ok the trades were:

L 1058 (buy LP) with 0.3% trail - trgt UP or higher

Rev to S 1062 (SCALP) with 0.15% fixed stop and trgt - exit at trgt

L 1058.5 (SCALP) - exit at trgt 1060

L 1053.50 with 0.3% trail, no trgt - exit at 16:14

Stoploss - hat off to u - yr analysis clearly showed that 1060 was not just scalp exit but Rev to S.
 

Attachments

  • tick1012.jpg
    tick1012.jpg
    39.9 KB · Views: 380
madasafish,

i c mate - u r long when stoch (38(9),9) slow is upsloping and short when down. U don't use fast-slow crosses
 
China

I am not sure if I should be doing this but say we have an uptrend across the board and the MACD five minute bars are making higher tops like an elevator. I look for the first lower top MACD bar which gives me an idea that we may need to cover our long or look for a possible short. Of course, any reverse short can only be entered if the technicals stand up. Did that make sense.

What is funny is how we are getting the same entries on the same set up but our eyes give us different patterns. What would be good is if I could programme ESignal to look for these patterns for me. I am sure it can be done.
 
matey i am a dinosaur with programming :) properly extinct in mexican jungle :)

MACD five min bars - u r talking macd of ES? Cash? Naz?

anyway - it makes perfect sense. usually with this approach ppl look at the cross of macd (real macd, not histogramme ) and its smoothing - but u essentially in terms of real macd (not histogramme) look for change of slope right? I traded on that b4 I discovered tick divs - the real prob is that u get a change of slope on a bull flag (in an uptrend) and tend to jump out after the 1st push. Rnt u finding that 2 b a prob?
 
Thats right mate, all the indecis are doing the same thing and on a penny, they begin to weaken. Not saying we should reverse but think about covering short, especially if we are coming up against resistance. It worked today on a couple of occasions. I suppose if it is just a bull flag, cover at the high and look for another long when the flag turns positive.
 
The SOX daily chart

Below is the SOX. There are a couple of areas of interest.

(A). The double top.
(B). The formation of a right shoulder as part of a large H&S.
(C). The possibility that we are forming an inverted H&S.
(D). The break of 487 yesterday and it inability break up above it again.
 

Attachments

  • dow 5min202.png
    dow 5min202.png
    96.3 KB · Views: 359
Top