Question:
Please see the attached Image for E-Mini S&P today.
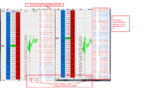
Context - After NFP and 1430GMT US Cash Open i saw this behavior. Price moved from 1744-1745 1H but there was volume discrepancy and offers were pulled before someone thrown a long market or limit looks like a machine. I've explained this in the image and questions are as below. Looking for a helpful insight!
1. The volume is not displayed was it because platform was slow but its displaying volume in ms?
2. The volume missing was it traded in Dark Pool? Will it be so fast to reflect on volume?
To reach 1745 total contracts on offer were 1169+1081+725+411= 3386. So in theory it needs 6722 increment in volume but someone pulled the offers before throwing in the market order to Buy.
Can we gain anything from above knowledge E-mini S&P moved 10 handles later on?
Any useful :idea: will be highly appreciated!
Good Luck Trading!
Please see the attached Image for E-Mini S&P today.
Context - After NFP and 1430GMT US Cash Open i saw this behavior. Price moved from 1744-1745 1H but there was volume discrepancy and offers were pulled before someone thrown a long market or limit looks like a machine. I've explained this in the image and questions are as below. Looking for a helpful insight!
1. The volume is not displayed was it because platform was slow but its displaying volume in ms?
2. The volume missing was it traded in Dark Pool? Will it be so fast to reflect on volume?
To reach 1745 total contracts on offer were 1169+1081+725+411= 3386. So in theory it needs 6722 increment in volume but someone pulled the offers before throwing in the market order to Buy.
Can we gain anything from above knowledge E-mini S&P moved 10 handles later on?
Any useful :idea: will be highly appreciated!
Good Luck Trading!