You are using an out of date browser. It may not display this or other websites correctly.
You should upgrade or use an alternative browser.
You should upgrade or use an alternative browser.
Trading ES (Q1 2004)
- Thread starter china white
- Start date
- Watchers 10
china white
Established member
- Messages
- 979
- Likes
- 12
hampy u may be right
I am leaning towars thinking that aberration days r part of parabolic runs where any sort of strength (in what usually is laggards) is viewed as a reason to reverse early weakness in techs and essentially just finish the day lifting all the offers. As such they r probably extra bullish days short-term.
However medium term any parabolic run needs to retrace, and the higher is the cliff the more painful is the fall-off 🙂 so .... but i fully agree too many aberration days as what we saw lately is a sign of "abnormality" (if its a valid word) in the mrkt.
good lk with yr PCs! 🙂
china white
Established member
- Messages
- 979
- Likes
- 12
china white
Established member
- Messages
- 979
- Likes
- 12
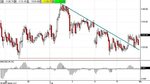
trend day rules!
perfect so far - trend up internals, secondary crosses outperforming AND u r given a test of Naz 40 ema/5min early in the day - u CANT wish for more :cheesy:
buy naz 40 ema on a trend up day. even with an entry as sh***y as mine 28 - its 11 pts so far.
perfect so far - trend up internals, secondary crosses outperforming AND u r given a test of Naz 40 ema/5min early in the day - u CANT wish for more :cheesy:
buy naz 40 ema on a trend up day. even with an entry as sh***y as mine 28 - its 11 pts so far.
Attachments
China, Delighted to say I'm posting this on the laptop wirelessly connected to the web. New PC superb! Just need to learn how to trade now!
Anyway question for you - How did you decide so early that this was a trend day. All I saw was a gap up open, then 1 white candle followed by 4 red ones. This was of course the retrace to the 40 ema on the Naz but unless you had decided to go long immediately you missed most of the move.
Thx for your help,
hampy
- Messages
- 2,325
- Likes
- 17
hampy:
Trading is just a game of stairs and landings. In other words, trends and sideways consolidation.
You'll find that the market goes up the stairs, waits on the landing, then goes up the stairs again, and so it goes on, in both directions up and down.
Yesterday was a sideways day, so therefore there was a reasonable probability that today would be a stairs/trending day.
The stairs and landing effect happens intraday too, with the market using the landing to get its breath back before the next set of stairs (in whatever direction).
Sorry for the child-like talk, but I like to keep things simple - so much easier to see and understand. :cheesy:
On ES this is quite easy to see on a 30 minute chart if you scrunch the bars up tightly.
Attachments
china white
Established member
- Messages
- 979
- Likes
- 12
hampy - at the time of entry:
comp > 0.5% up, dow < 0.5% up, 3:1 internals
same ndx/spx with 2:1 internals
sox beating comp 2:1, both bix and bkx beating spx
and u get 40 ema/5min test early in the day
what else do u want from santa in february 🙂 ?
comp > 0.5% up, dow < 0.5% up, 3:1 internals
same ndx/spx with 2:1 internals
sox beating comp 2:1, both bix and bkx beating spx
and u get 40 ema/5min test early in the day
what else do u want from santa in february 🙂 ?
- Messages
- 2,325
- Likes
- 17
For posting charts from Qcharts:
Resize the individual chart window to the size you want it to appear, right click on the chart, and select Export, Image.
Save as type = .jpeg, and I save mine on my desktop for easy reference. Then click Save. You'll be asked for the Quality; I use 70. Then click OK.
When posting a chart here, use Post Reply button at the bottom right of the thread (not the quick reply box), and select the image from your desktop. Easy peasy!
The advantage of doing it this way is that you don't get all the program around each of the charts, just the actual chart itself, although you may need to say in your copy which timeframe/stock the chart refers to as that is not included with your chart.
china white
Established member
- Messages
- 979
- Likes
- 12
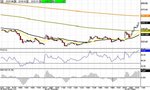
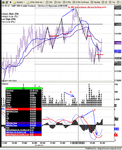
when does 20 ema take precedence over 40 ema (naz)?
alright - here is what I am working at at the mo and any input will be appreciated.
we know per our approach that on a trend up day we buy pullbacks to naz 40ema/5min. We buy pullbacks to naz 20 ema/5min only on "bull gorgeous" days, when both 240 and 600 emas r taken out by 10:30 ON ALL INDICES.
Apparently this needs to be "tweaked" 😕
Friday was NOT EXACTLY a "bull gorgeous" day at 10:30 as on NDX and Comp 240 and 600 mas were not left in the dust - HOWEVER, they were on all other indices (SOX, BIX, BKX, SPX, Dow).
however as the chart shows 20 ema/5min took precedence over 40 ema/5 min (Naz).
My present thinking is: if 240 and 600 emas r taken out by 10:30 on more than half of indices we r watching, Comp/Dow is more than 2:1, SOX/Comp is more than 2:1 and banks r leading spooz => even tho strictly it is not "bull gorgeous" we buy pullbacks to 20.
Actually it cost me a bit on Friday. In the afternoon session I was waiting for a test of 40 on naz and missed the entry at about 1137.50 for 4 extra pts on top of the morning gain. This is nothing to cry about - but it cud've easily been another 11 - and that is NOT something to miss 😈
any thoughts will be welcome. Just remember - the worst thing is overloading a robust system with too much detail. ALL IDEAS shud be not more than 200 characters :cheesy: make it simple!
Attachments
china white
Established member
- Messages
- 979
- Likes
- 12
Skim, yr quote:
"Yesterday was a sideways day, so therefore there was a reasonable probability that today would be a stairs/trending day."
i'd say this is the best simple words explanation as to why McClellan's "minor change" leading to a McClose works!
many thx Skim. u've def got a way with words 🙂
"Yesterday was a sideways day, so therefore there was a reasonable probability that today would be a stairs/trending day."
i'd say this is the best simple words explanation as to why McClellan's "minor change" leading to a McClose works!
many thx Skim. u've def got a way with words 🙂
china white
Established member
- Messages
- 979
- Likes
- 12
Hampy in its simplest form if comp is up 2% at a given point in time, and dow up 1% - their internals r 2:1 etc....
hillbillie
Junior member
- Messages
- 29
- Likes
- 0
I had a look at the 40/5min
Could you post a chart showing buy/sell points.
I looked back 1/2/5 days and couldn't see a clear signal to my untrained eye, always looking for input please clarify
Could you post a chart showing buy/sell points.
I looked back 1/2/5 days and couldn't see a clear signal to my untrained eye, always looking for input please clarify
china white
Established member
- Messages
- 979
- Likes
- 12
HB - it is 2 buys at right b4 10:00 and at 14:15 - look at naz chart posted above. the yellow line is 20ema/5min, the black one - 40. First for up to 12 pts, latest - for up to 4.5 pts.
stoploss please
Established member
- Messages
- 780
- Likes
- 10
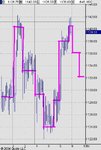
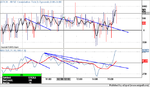
ES 9/2 Lets mix and match
Hi
Not posted for a time. Been a tad busy. Anyway, since our last discussions I have been trying to amalgamate what Skim, Sandpiper and China have kindly given me.
The ES chart posted shows long entries played out in conjunction with black art and China's 20/40 ma bounce plays.
Volume indicated the top and the cross overs in MA and MACD signal confirmed this.
Still do not understand EW patterns but todays action looks like it to me. Skim, what do you think??
I like the MACD signal line. Above zero, bullish and below zero bearish. Cross overs indicated the point in the wave. Not sure if that makes sense.
I know China does not rely on Tick so much on days like today but I still follow it. The Tick MA was above zero all day which is another bullish indication. The Tick MACD signal line also painted an nice visual picture.
Attachments
china white
Established member
- Messages
- 979
- Likes
- 12
stoploss u actually found a better way to put it - on a trend day when tick is constantly above 0, tick neg div is most likely just a pause, not a short entry.
of coz unless internals start pointing to trend reversal after lunch (+10/-10 days) when tick neg div will probably give u the best reversal entry. however, u understand that at the top of the tide, ALL previous tick readings will be above 0, so trend reversal signal WILL HAVE to come from somewhere else, i.e. change in internals, relative position of indices towards their key averages etc....
of coz unless internals start pointing to trend reversal after lunch (+10/-10 days) when tick neg div will probably give u the best reversal entry. however, u understand that at the top of the tide, ALL previous tick readings will be above 0, so trend reversal signal WILL HAVE to come from somewhere else, i.e. change in internals, relative position of indices towards their key averages etc....
stoploss please
Established member
- Messages
- 780
- Likes
- 10
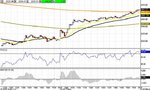
China
May have got some thing here. Will post charts laters.
Trend line breaks in Tick MA/MACD fast signal line when price action is at 20MA and you are waiting for a 123 pattern entry.
Andy
May have got some thing here. Will post charts laters.
Trend line breaks in Tick MA/MACD fast signal line when price action is at 20MA and you are waiting for a 123 pattern entry.
Andy
stoploss please
Established member
- Messages
- 780
- Likes
- 10
stoploss please
Established member
- Messages
- 780
- Likes
- 10
Similar threads
- Replies
- 11
- Views
- 8K
- Replies
- 67
- Views
- 18K
- Replies
- 11
- Views
- 6K
- Replies
- 202
- Views
- 81K