Trading ES (Q1 2004)

stoploss:

To answer your questions

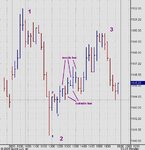
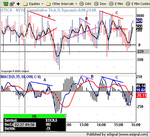
1. Yes I did. How? Just something I've noticed is that the market very rarely drops more than 10 points without a jolly good pullback. So the high was at 1152, so while the price was dropping quite fast I had in mind 1142 or thereabouts for the bottom of that drop, with 1140 as definite support. I was watching the volume tick up (or shoot up, rather), and you can often sense a last-minute panic which also helps identify the bottom.

2. Yes, very true. However, the 10 min chart didn't have a lower low. I did short between green 2 and green 3, but only for a swift trade because the price was, by then, in an up-trend. There were lots of other reasons, too, such as the 'top' at green point 2 was messy, which usually indicates a small pullback, not a proper turn. It's difficult to describe.
 
Skim,
Please be aware that this is all in wonderful 20/20 hindsight. And after a sleep from the watching (ie not trading!) activity! :eek:
Although I did think that the double bottom at 13:50 EST was a number two corecting wave and the start of another up leg, but FEAR got in the way! :rolleyes:
On the attached why is this not a 1-2-3 preceeding the green one on your chart?
Cheers
Q
 

Attachments

  • screenshot001.png
    screenshot001.png
    41.1 KB · Views: 326
Last edited:
123's are fractal

Quercus

That is also a 123. The problem is that smaller patterns do not always deliver sufficient points. That's when volume and what Skim said about the preceding ten point drop is taken into account.
 
Quercus:

Yes, it is a 123. But it's not a good one, and your reward from it would not have been good - it's good for a scalp, but not much more.

The chart below is ES 10 minutes; you can only really see the little 123 by squinting at it, whereas the big 123 you can see from the other side of the room. The 'other side of the room' trades are the really bankable ones, and the ones you should be aiming for, as you can see from the resultant move. You can't see the little 123 on a 30 minute chart, whereas you can see the big one.

The fear you speak of is just a little voice inside telling you that it's not a good 123 - as it wasn't. So I would say that in that instance your intuition was telling you it wasn't good, but you interpreted that wrongly as fear.

Trading the little 123 is perfectly OK when you've got a lot more experience under your belt. Until then, stick to the big picture ones as they're much easier and allow for a sloppy entry if you're late in seeing the move.

Take a look at all the inside bars and outside bars after that little 123 - this is just mess, and gives you a clue that the move is not 'clean'. Do you notice that the ones I've marked are the only inside/outside bars which appeared on the 10 min chart all day?

There's an art in spotting 'clean' bars and 'messy' bars, and from this you can deduce that there is indecision in the market during the messy bars. Look again, and you'll see that it's difficult to see the higher highs and higher lows in that mess. Therefore, as a general rule when you're a beginner dark sider, when you see inside and outside bars, just get out and wait for the market to clean up its act! LOL
 

Attachments

  • cme-es04h- 10 minute.jpg
    cme-es04h- 10 minute.jpg
    51.9 KB · Views: 386
Forgot to say. I've said this loads of times before, but when you have a strong move in the morning, then it's likely to go sideways during lunch, and vice versa.

So just think of all the pro traders sitting at their screens in Chicago and New York who have ridden that trend down and have got a nice fat profit for Friday morning's work. It's lunchtime - if you were in their shoes, wouldn't you go and have a nice lunch? I would. They did. And the market then resumed out of the mess at 14:00.

So that's another reason why trading the correction is not always an easy ride.
 
skim - very impressive analysis!

Your approach scores very high on Rewards/Simplicity scale. U can explain your sys to a kid and still get excellent entries and exits. On my end, however, how wud u explain "macd of tick" to a kid? :)

One Q if u dont mind skim. Pls look at 5 min bars on Friday at around 14:30 and 15:20.

U can c that at 14:30 u had LHs - and according to my current understanding of your approach (pls slap me if i am wrong :) ) u might be willing to short there. Moreover, than red candle right afterwards gave u also a LL, didn't it? If u shorted there, u'd hv obviously missed the final thrust to 1150.

I will tell u why I stayed long there up to 1149. On that 14:20ish High we had Higher ES (distance), Higher Tick (speed) and at least equal Macd of Tick (acceleration) => which means its not the final High (more distance to travel). However, on 14:50ish High we had a clear Tick neg div (speed going down, obviously the brake pedal engaged), which was further supported by 15:15.

How do u deal with this issue?

many thx
 
China m8

I will tell u why I stayed long there up to 1149. On that 14:20ish High we had Higher ES (distance), Higher Tick (speed) and at least equal Macd of Tick (acceleration) => which means its not the final High (more distance to travel).

Speed stuff?? Come again.

Ta
 
China:

Your question is not easy to answer, but I'll have a go.

This may sound silly, but the 14:30 formation is not a top because it doesn't look like one. That doesn't sound very helpful I know.

If you look at the bars in that 14:30 formation they are basically shortish in length, and going sideways, over a 25 minute period (5 x 5 min bars), where the difference in the highs is only a couple of ticks. Tops don't do this, but highs before pullbacks do.

It often helps to see what the Nasdaq is doing, or the Dow, as one of them will have a very good and clear pattern, and this can often help. On that formation the COMPX had a very clear sideways action at the highs - I'll post the chart in the following post.

Tops are formed relatively quickly - the price shoots up then realises that it's landed in a den full of bears who are all sitting there waiting to give it a good slap down. So if there is any hesitation by the price (shown by sideways action) then it's not in a bears den, but just having a breather before getting up sufficient steam by having a pullback to get it back up to a higher high.

One formation which appeared on Friday but which is relatively uncommon is the three steps up. The 10:00 formation has a high bar, and then two further high bars which are the same distance between the highs - in this case 0.50 point.

The same formation happened at the 14:30 formation, but note that this time there is only 0.25 point between the three highs. So this again shows you that it is a weaker formation, and therefore not a top.

It's all down to the fact that tops look like tops. And if it doesn't look like one, then chances are that it isn't one. This is where you bring in volume you help you as a secondary indicator. The art is in knowing what a top looks like, and that comes with practice.

The following chart is the 5 min ES for Friday, showing the three steps up.
 

Attachments

  • cme-es04h- 5 minute.jpg
    cme-es04h- 5 minute.jpg
    57.9 KB · Views: 299
And here's the COMPX 5 minute chart of the 14:30 formation:
 

Attachments

  • nasdaq combined composite indx- 5 minute.jpg
    nasdaq combined composite indx- 5 minute.jpg
    27.6 KB · Views: 291
skim - many thx. u r right the Comp pic seals it.

stoploss - forget about tick for a sec. just assume u've got ES and Macd of ES. ES move is the distance travelled, Macd bar value is the speed of journey and Macd making HHs or LHs shows u acceleration. THIS IS THE WHOLE CONCEPT OF DIVERGENCE INNIT? - ES travels further (higher highs) but on reducing speed due to deceleration (lower highs in Macd).

Mathematicians here - pls dont slap me with a big trout :) - I know Macd is not officially the first derivative of ES, like velocity is the 1sr derivative of distance. But any indicator of macd, rsi, stoch rsi, cci etc.... league - is an attempt at measuring the VELOCITY.

now tick. its even less of the 1st derivative of the distance ES travels - mathematically speaking its not even related to it. BUT since it is a DIRECT MEASURE of cash market buy/sell intensity - i reckon its even better than any macd, rsi etc.... attempt at calculating velocity.

So assuming Tick is market velocity - what is Macd of tick? acceleration :)
 
just an addition to my last post - to illustrate my point:

In dark siders' approach :) the distance is obviously the length of a particular bar, whilst their proxy for velocity is the increments in HHs and HLs - so when u start getting LHs and LLs that means deceleration reversed the velocity and the market is driving in opposite direction.

Think of an inverse C&H. thats exactly the path of a tennis ball u toss up - constant deceleration (gravitation) reduces the upward speed until the ball's path peaks in a parabolic way and goes back down to Earth at increasing velocity. Whic means that a C&H is a case of anti-gravitation :)
 
Many thanks to all of you including the Mathematician of Italian extraction. ;)
China, that was a great explanation of your outlook on price action, and clarified many areas of confusion!

Skim, a concise and clear explanation of "relativity" too!

Here's another one for you - At the stronger three steps up around 10:15, there was a drop of 1pt followed by a DT on the 5min chart. Is this something to keep an eye out for in the future, as it seems to form a level of what you might call "mini resistance"?
These 1-2-3 patterns are easily confused with Ross Hooks, sitting in the trend pattern, and now that I think about it maybe this is what the problem is for me. Distinguishing between the two can often be tricky. Or pehaps not, as I look at the chart now! The top is clearly the top for the reasons discussed earlier, and the green 1-2-3 is also a RH as it's not a top , and also lies within the trend. Mmmm, maybe we have something here :?:
And just to let you know my "fear" was general rather than specifically related to the weak 1-2-3, that was something I only looked at after you posted Skim.
China, I must get in front of the mirror more often and repeat my mantra....how does it go again? :LOL:
Learning all the time.
Q
 
Q - :) that was way to go for a 12 yr old - u sound much older mate :) just believe in yrself and control yr losses - and u'll be fine.
 
Hi folks, been meaning to ask this for a while and Friday's opening highlighted it again.
Can the previous day's action be reliably used to position yourself to trade as soon as the market opens. The 1st 35 mins would have yielded up to 6 points if you could have been in, within 5 mins or so of the open. I know our MACD is unreliable for the first 50 mins, but just wondering whether pure price action or RSI divs can be utilised from the start.
Thx,
hampy
 
hampy - i personally rarely do it and i'll explain why - 1) the mrkt needs some time to shake out and establish itself as a trend day etc.... 2) for any divergence u need at least two anchors, and preferrably at least 15-20 mins apart. However, yes there r situations where u may take a resonable punt at the open. Personally I wudnt recommend trading at the open to some1 w/o loads of trading experience under the belt. My opinion.
 
I wouldn't contradict anything that China has said in the post above. However, I do trade the open because I am trading purely on price bars, so I don't have to wait for any indicator to settle.

If you are using just price action then trading the open is great. But a few provisos:

1. Only consider doing so if the overnight and opening price indicate a good setup. A double bottom pre-market is a wonderful set-up, but it happens very rarely indeed.

2. Don't trade the first few bars just for the sake of it - there are no medals to be won.

3. You need to be very flexible and agile, and be prepared for the twisting and turning which often happens. So scalping is the best way, until a definitive trend is established (or anchors as China refers to).

4. Some traders find it psychologically difficult to take a loss on their first trade, and this unsettles them for the rest of the day as they are then playing catch-up. This alone is probably the best reason not to trade the open unless you have a lot of experience under your belt.

5. All the pros trade the open, and when they're jostling for position the market can be abnormally whipsawey, particularly at the top and bottom of a trend.

6. Look to see what figures are being announced - 'big' figures at 09:45 tend to create a millpond effect as there is not sufficient time for the market to settle, whereas there is sufficient time for 10:00 figures announcements.

7. Use the first 5 min volume bar as an indication of who's in the market - low volume is retail, high volume is big boys.

8. Mondays have the lowest volume, and generally there's not a lot of points to be made because volatility is often low.

9. Be wary of anyone who tells you categorically not to trade the open under any circumstances - it's a sign of fear because they cannot do it.

As China says, there are situations when you can take a reasonable punt - but it will be experience which tells you when those situations occur, and until then practice paper trading the open.
 
Thx folks, I'm in no rush to try it myself, just interested to see if it could be done.
Cheers,
hampy
 
How long for a divergence

China

Skim in her previous posts has said that a 123 pattern should take a long time to develop and the the greater the time it takes to set up, the more points on the table are there for the taking.

In your opinion, how many five minute tick bars does it take for a Macd Tick divergence is it needed for a set up. I realise it is not an exact science, just looking for your opinion for a workable minimum.

The attached post shows three divergences for friday. B was a small scalp and A anc C were the big moves.

Cheers
Andy
 

Attachments

  • dow 5min245.png
    dow 5min245.png
    73.2 KB · Views: 254
Top