china white
Established member
- Messages
- 979
- Likes
- 12
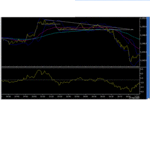
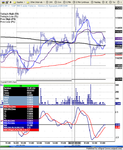
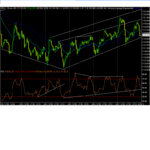
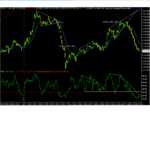
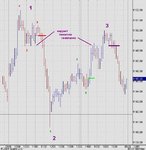
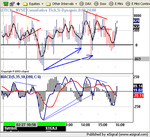
2 things to watch imo: C&H with trgt 1157.50, and on a shorter time frame, bull flag target "almost" met:
http://www.ttrader.com/mycharts/display.php?p=19802&u=chinawhite&a=China\'s ES&id=915
http://www.ttrader.com/mycharts/display.php?p=19802&u=chinawhite&a=China\'s ES&id=915