Stan Weinstein's Stage Analysis

Hi guys,

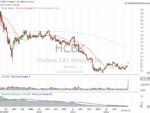
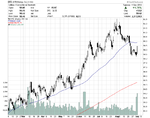
I am a little bit shy posting this as i am a complete rookie and i am preparing for my first buy order using real money. As i was going through the list of companies in the Bankings group i came across HCBK, which lokks to me that it is just about to breakout if the price goes above resistance $7.60. It's got very impressive volume, Relative strength is just moving into positive territory.
What do you guys feel about it?
 

Attachments

  • HCBK.png
    HCBK.png
    68.8 KB · Views: 348
I am a little bit shy posting this as i am a complete rookie and i am preparing for my first buy order using real money. As i was going through the list of companies in the Bankings group i came across HCBK, which lokks to me that it is just about to breakout if the price goes above resistance $7.60. It's got very impressive volume, Relative strength is just moving into positive territory.
What do you guys feel about it?

Hi vali83, I'd suggest going back and re-reading chapter 3 and especially page 75 Forest to the Trees Approach.

WHAT TO BUY

My "Forest to the Trees" Approach

Just as important as when to do new buying is what to buy. This is actually a far more complicated decision to reach. Once you digest the ideas in this section, it too will become routine.

It is really a three-part equation that I call my "Forest to the Trees" approach. What I mean is that you should work from the larger question - how's the overall market - down to the smaller component - which stock looks best to buy. In between these two extremes is the middle part of the equation - which group is acting best technically. So the process unfolds in the following manner:

  1. What's the trend of the market? If it's negative, you'll want to do very little if any buying, even if you see some stocks breaking out. Your probabilities of success are quite low when the market trend is going against you.
  2. Which few groups look the best technically? The importance of this question can't be overemphasized since my studies have consistently shown that two equally bullish charts will perform far differently if one is from a bullish sector while the other breakout is in a bearish group. The favorable chart in the bullish group will often quickly advance 50 to 75 percent while the equally bullish chart in the bearish group may struggle to a 5 to 10 percent gain.
  3. Once you determine that the market trend is bullish and Group A acts the very best technically, the final step in the process is to zero in on the one or two best individual chart patterns in that sector.

If you follow this three-step process, you will find yourself heavily invested in the best acting stocks when the market is powering ahead, and sitting on large cash reserves when the overall trend turns bearish.

Quote taken from page 75 in the book

Also, the S&P 500 is currently consolidating at the top of a Stage 3 range and so although you should be looking for potential stock picks for if the market breaks out into a Stage 2 continuation - you shouldn't be doing any buying yet. As with Weinstein's investor method you should mostly only be buying when the broad market is in Stages 1 and 2.
 
Hi again,

Thank you guys for your opinions. I haven't decided yet what to buy as i haven't finished scanning all the sectors and i can't apply the forest to the trees approach yet. HCBK just looked good to me and i wanted to know your opinion about it since you are far more experienced than i am. Your answers were very useful to me as i am creating myself a picture about the markets and i need someone to confirm that i am understanding it right.
Thanks again and Isa it good to have you back after your op.
 
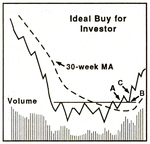
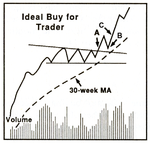
Something I'd like to do on here in more detail that we've only discussed on a case by case basis so far is the different types of Weinstein method entry points. As obviously the different entry points pose different challenges in that there is different risk reward profiles; some take much longer to work out as they may have already run a long way in order to reach the breakout point etc; and some will give fast results but have more chance of failing. The list could go on..

I also want to look at things like buying Stage 2 breakouts to new all time highs and whether it's better for example to buy on the initial breakout or to wait for the retest of the breakout level to establish a lower risk profile on the trade.

So what I propose is that when I have a bit more time in the next few weeks, I'll start laying out the various setups and their entry point options and examine them with multiple real examples so that we can all feel more confident about not only what to look for for the method, but also various things to anticipate when you're in a trade so that we don't get shaken out of the good ones.

Anyone have any thoughts on this?

I've attached the diagrams of the basic Stage 2 entry point for investors from the book and the Stage 2 continuation entry point for traders. On each of these you'll see the breakout highlighted by point A, but I've added points B and C as these are both valid entry points as well and are lower risk imo.
 

Attachments

  • Ideal-buy-investor.png
    Ideal-buy-investor.png
    134.2 KB · Views: 313
  • Ideal-buy-trader.png
    Ideal-buy-trader.png
    125.4 KB · Views: 336
Last edited:
Dte

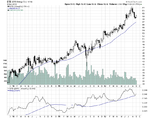
I ran a scan in my chart software for crosses above the zero line on the daily Mansfield RS and got 21 hits. Of those DTE Energy looked the most interesting to me as it had a good volume spike in the last two days and reversed back towards the 50 day MA. It's still below the 50 day MA, so if I was going to trade it I'd like to see a close above that and the $60 level.

The weekly chart is in Stage 2B and the sector chart looks similar although it's Mansfield RS is below the zero line, but as we know the stocks have to move first before it shows up in the sector charts.

attachment.php


attachment.php
 

Attachments

  • sc-63.png
    sc-63.png
    22.4 KB · Views: 1,052
  • sc-64.png
    sc-64.png
    20.5 KB · Views: 1,035
Last edited:
How do you all feel about PSTI? I bought it (in my fantasy portfolio...) back in July and then sold it for a nice little profit. At the time I bought it simply on volume, MA and RS and it worked out. Now, it has been in the news an awful lot and I think it will be picking up some more steam. Time for continuation buy? To me it looks great on the weekly and the daily.

Just a side note- a while back I listened to the June 30 interview that Stan gave and remember thinking that ppl must have been trying to get those freebies he mentioned in the previous interview so that was hilarious isa-

Also, I understood the interview the same as lplate did. I think Stan was trying to say that the market was crazier than he had ever seen and that it was not a time to sit out- but rather to find individual stocks (not really relying on sector) in which to position yourself/ That was a little while ago though so who knows.
 

Attachments

  • PSTI_Weekly.png
    PSTI_Weekly.png
    46.3 KB · Views: 309
  • PSTI_Daily.png
    PSTI_Daily.png
    42.1 KB · Views: 307
Another one I essentially did the same thing with was STEM. I sold both of these off with my mind being short term because of the uncertainty out there. This was my very 1st week of even trying to fake trade and I simply found these by googling "stocks trading on high volume". Now I know how to preform better searches (thanks to you guys) but both of these still look promising to me. Health care on a whole looks great and Biopharma within also looks good to me-
 

Attachments

  • STEM_Weekly.png
    STEM_Weekly.png
    39.5 KB · Views: 289
  • STEM_Daily.png
    STEM_Daily.png
    42.7 KB · Views: 300
How do you all feel about PSTI? I bought it (in my fantasy portfolio...) back in July and then sold it for a nice little profit. At the time I bought it simply on volume, MA and RS and it worked out. Now, it has been in the news an awful lot and I think it will be picking up some more steam. Time for continuation buy? To me it looks great on the weekly and the daily.

Another one I essentially did the same thing with was STEM. I sold both of these off with my mind being short term because of the uncertainty out there. This was my very 1st week of even trying to fake trade and I simply found these by googling "stocks trading on high volume". Now I know how to preform better searches (thanks to you guys) but both of these still look promising to me. Health care on a whole looks great and Biopharma within also looks good to me-

It's a very dangerous game playing the small penny pharma stocks imo, as they can be bid up very quickly on speculation of some new drug or a possible take over and then crash down just a quickly when it doesn't materialise. Of course, there will be spectacular winners occasionally, but it's not a place to play for a sensible trader imo. I recommend sticking to the large cap stocks in the S&P 500 and unleveraged ETFs as they have much greater liquidity and can give you very good gains and much less risk. As risk management should be a key consideration in your trading plan.
 
Hecla Mining - HL

For an alternative way to play the silver and gold turn around at the moment a good option looks to be Hecla Mining (HL). I've played this Silver stock a few times in the past and it tends to track the silver moves reasonably well as it's mostly a silver miner with some gold as well.

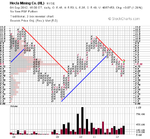
The weekly Mansfield RS turned positive yesterday and cumulative volume has been on a weak buy signal since June. It made a potential Stage 2A breakout yesterday above the daily swing high that had formed above the 200 day MA, although it has a fair amount of resistance still to $7. But the major volume resistance can be seen on P&F chart in 5-5.50 range.

So a trader pick imo, with a short term $7 target. Attached is my charts.
 

Attachments

  • HL_Weekly_4_9_12.png
    HL_Weekly_4_9_12.png
    121.7 KB · Views: 281
  • SharpChartv05-20.png
    SharpChartv05-20.png
    30.4 KB · Views: 269
Okay, thanks for the advice Isa- I guess that is why I haven't bought in yet. When I do finally pull the trigger with real money, I will likely have only start with $2000. Do you have a recommendation as to management of a portfolio that size? I was looking at it in the wrong way thinking I should buy the lower priced stocks. Maybe I should just stick to a small # maybe 2 or 3 positions max?

As for your "entry point" post, my initial reaction is to go with point C on both investor and trader charts. I thought about this a lot while reading the chapter. Point A) it seems difficult, time consuming, and a waste of my small amount of capital, to find those stocks that are about to break out, set a gtc buy-stop, and then sell immediately if it is not confirmed with high volume. Point B) I see this as trying to guess a bottom (as the breakout could have been bunk). I know that it should bounce off the old resistance/new support but it makes me nervous. Therefore, I would go for the smaller profit of point c.
 
Okay, thanks for the advice Isa- I guess that is why I haven't bought in yet. When I do finally pull the trigger with real money, I will likely have only start with $2000. Do you have a recommendation as to management of a portfolio that size? I was looking at it in the wrong way thinking I should buy the lower priced stocks. Maybe I should just stick to a small # maybe 2 or 3 positions max?

The majority of the stocks in the S&P 500 trade under $100, and you only need 1 share. But, it's all about your trading costs when you have a small portfolio, as they need to be kept down as low as possible, as for example if it costs you $9.99 to buy and $9.99 to sell your position, then if you had a $500 position minus your costs, then you are starting the trade 4% down and that's not including the spread as well. So it's vital to get the lowest transaction costs possible as you should be aiming for costs of 0.5% or less per trade imo.

I believe interactive brokers only charge $1 per side for US stocks, but you need to have $10k minimum to open an account or $3k if your are under 26. Here's the link to their site: http://individuals.interactivebrokers.com/en/p.php?f=minimumDeposits

Other than that I'm not sure for US residents as you can't use the small spread betting accounts that lots of UK new traders start with. Although most would say that's probably a good thing.
 
Well, my broker charges 7 bucks per trade which isn't bad considering everything they are providing to me..Also, 500 minimum on the account. On the plus side, I won 10 free trades by getting the highest return in a fantasy challenge last month- Won't last long but can't hurt.

What do you consider penny stock? Under 5 USD?
 
Well, my broker charges 7 bucks per trade which isn't bad considering everything they are providing to me..Also, 500 minimum on the account. On the plus side, I won 10 free trades by getting the highest return in a fantasy challenge last month- Won't last long but can't hurt.

Well done on winning the free trades. But in your case I'd say whether you are using the trader method or the investor method is decided for you, as you can't afford the transaction costs on the trader method as it would be too high a percentage per trade for you. So I'd suggest taking advantage of your free trades to build a small portfolio of 4 to 6 positions. Half of which could be in index, sector or commodity ETFs to give you broader exposure with lower risk, and the other ones could be in some individual stocks. But with such small positions you might be better entirely in ETFs as individual stocks can be more volatile with earnings etc. And any stop outs for you will cost $7 and then another $7 to get into a new position etc.

What do you consider penny stock? Under 5 USD?

Yep, anything under 5 I generally avoid personally.
 
Re: Stockcharts - Mansfield

Thanks lplate,

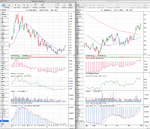
I think i'll give it a try. Currently i have managed to set up my free account at freestockcharts.com. One important thing for me is that i can have 2 views, one for weekly and one for daily chart and i can have them vertically split. When i select a symbol both the weekly and daily charts are updated, so it is very easy for me to scan through a large number of symbols and see very quickly how they look.
You can see a screenshot below
 

Attachments

  • freestock_view.JPG
    freestock_view.JPG
    308.8 KB · Views: 346
Re: Stockcharts - Mansfield

Thanks lplate,

I think i'll give it a try. Currently i have managed to set up my free account at freestockcharts.com. One important thing for me is that i can have 2 views, one for weekly and one for daily chart and i can have them vertically split. When i select a symbol both the weekly and daily charts are updated, so it is very easy for me to scan through a large number of symbols and see very quickly how they look.
You can see a screenshot below

That's looks good to me, but if you want it set up the same as the ones I have in the thread for comparison then a few adjustments are needed.

  1. The daily chart should have a 50 day simple moving average and a 200 day simple moving average.
  2. The daily Relative Strength vs S&P 500 moving average (zero line) is different to the weekly and should be a 200 day simple moving average instead.
  3. You don't need the 200 week MA on your weekly chart. Only the 30 week MA. But that of course is up to you :)
  4. Also, just a note. It's better to save your screenshots as png files instead of jpgs, as they will be smaller file sizes and crisper on the charts.
 
US Industry Sectors & Sub-sectors

Below is the Complete Industry Listing for S&P Sectors arranged in their Industry groups that you can view on stockcharts:

Consumer Discretionary (XLY)
$DJUSHB - Dow Jones US Home Construction Index
$DJUSFH - Dow Jones US Furnishings Index
$DJUSRP - Dow Jones US Recreational Products Index
$DJUSRQ - Dow Jones US Recreational Services Index
$DJUSAV - Dow Jones US Media Agencies Index
$DJUSPB - Dow Jones US Publishing Index
$DJUSHD - Dow Jones US Durable Household Products Index
$DJUSRB - Dow Jones US Broadline Retailers Index
$DJUSCS - Dow Jones US Specialized Consumer Services Index
$DJUSRA - Dow Jones US Apparel Retailers Index
$DJUSAU - Dow Jones US Automobiles Index
$DJUSFT - Dow Jones US Footwear Index
$DJUSRS - Dow Jones US Specialty Retailers Index
$DJUSHI - Dow Jones US Home Improvement Retailers Index
$DJUSBC - Dow Jones US Broadcasting & Entertainment Index
$DJUSBE - Dow Jones US Business Training & Employment Agencies Index
$DJUSLG - Dow Jones US Hotels Index
$DJUSTT - Dow Jones US Travel & Tourism Index
$DJUSRU - Dow Jones US Restaurants & Bars Index
$DJUSCF - Dow Jones US Clothing & Accessories Index
$DJUSTY - Dow Jones US Toys Index
$DJUSAT - Dow Jones US Auto Parts Index
$DJUSCA - Dow Jones US Gambling Index

Technology (XLK)
$DJUSCR - Dow Jones US Computer Hardware Index
$DJUSCE - Dow Jones US Consumer Electronics Index
$DJUSDV - Dow Jones US Computer Services Index
$DJUSEC - Dow Jones US Electrical Components & Equipment Index
$DJUSNS - Dow Jones US Internet Index
$DJUSSW - Dow Jones US Software Index
$DJUSWC - Dow Jones US Mobile Telecommunications Index
$DJUSCT - Dow Jones US Telecommunications Equipment Index
$DJUSAI - Dow Jones US Electronic Equipment Index
$DJUSSC - Dow Jones US Semiconductors Index
$DJUSOE - Dow Jones US Electronic Office Equipment Index

Industrial (XLI)
$DJUSMT - Dow Jones US Marine Transportation Index
$DJUSTS - Dow Jones US Transportation Services Index
$DJUSDS - Dow Jones US Industrial Suppliers Index
$DJUSTK - Dow Jones US Trucking Index
$DJUSHV - Dow Jones US Heavy Construction Index
$DJUSBD - Dow Jones US Building Materials & Fixtures Index
$DJUSPC - Dow Jones US Waste & Disposal Services Index
$DJUSIV - Dow Jones US Business Support Services Index
$DJUSAF - Dow Jones US Delivery Services Index
$DJUSFE - Dow Jones US Industrial Machinery Index
$DJUSDN - Dow Jones US Defense Index
$DJUSRR - Dow Jones US Railroad Index
$DJUSID - Dow Jones US Diversified Industrials Index
$DJUSAS - Dow Jones US Aerospace Index
$DJUSAR - Dow Jones US Airlines Index
$DJUSHR - Dow Jones US Commercial Vehicles & Trucks Index

Materials (XLB)
$DJUSPT - Dow Jones US Platinum & Precious Metals Index
$DJUSCP - Dow Jones US Containers & Packaging Index
$DJUSPP - Dow Jones US Paper Index
$DJUSCX - Dow Jones US Specialty Chemicals Index
$DJUSAL - Dow Jones US Aluminum Index
$DJUSNF - Dow Jones US Nonferrous Metals Index
$DJUSPM - Dow Jones US Gold Mining Index
$DJUSCC - Dow Jones US Commodity Chemicals Index
$DJUSST - Dow Jones US Steel Index

Energy (XLE)
$DJUSPL - Dow Jones US Pipelines Index
$DJUSOL - Dow Jones US Integrated Oil & Gas Index
$DJUSOS - Dow Jones US Exploration & Production Index
$DJUSOI - Dow Jones US Oil Equipment & Services Index
$DJUSCL - Dow Jones US Coal Index

Consumer Staples (XLP)
$DJUSVN - Dow Jones US Distillers & Vintners Index
$DJUSFP - Dow Jones US Food Products Index
$DJUSTB - Dow Jones US Tobacco Index
$DJUSRD - Dow Jones US Drug Retailers Index
$DJUSFD - Dow Jones US Food Retailers & Wholesalers Index
$DJUSHN - Dow Jones US Nondurable Household Products Index
$DJUSCM - Dow Jones US Personal Products Index
$DJUSTR - Dow Jones US Tires Index
$DJUSDB - Dow Jones US Brewers Index
$DJUSSD - Dow Jones US Soft Drinks Index

Health Care (XLV)
$DJUSBT - Dow Jones US Biotechnology Index
$DJUSAM - Dow Jones US Medical Equipment Index
$DJUSMS - Dow Jones US Medical Supplies Index
$DJUSHP - Dow Jones US Health Care Providers Index
$DJUSPR - Dow Jones US Pharmaceuticals Index

Utilities (XLU)
$DJUSWU - Dow Jones US Water Index
$DJUSGU - Dow Jones US Gas Distribution Index
$DJUSFC - Dow Jones US Fixed Line Telecommunications Index
$DJUSVE - Dow Jones US Conventional Electricity Index
$DJUSMU - Dow Jones US Multiutilities Index

Financial (XLF)
$DJUSDT - Dow Jones US Diversified REITs
$DJUSSP - Dow Jones US Specialty Finance Index
$DJUSSR - Dow Jones US Specialty REITs Index
$DJUSMF - Dow Jones US Mortgage Finance Index
$DJUSIO - Dow Jones US Industrial & Office REITs Index
$DJUSMR - Dow Jones US Mortgage REITs Index
$DJUSRN - Dow Jones US Residential REITs Index
$DJUSIP - Dow Jones US Property & Casualty Insurance Index
$DJUSRL - Dow Jones US Retail REITs Index
$DJUSAG - Dow Jones US Asset Managers Index
$DJUSFA - Dow Jones US Financial Administration Index
$DJUSIF - Dow Jones US Full Line Insurance Index
$DJUSIU - Dow Jones US Reinsurance Index
$DJUSHL - Dow Jones US Hotel & Lodging REITs Index
$DJUSSF - Dow Jones US Consumer Finance Index
$DJUSEH - Dow Jones US Real Estate Holding & Development Index
$DJUSIL - Dow Jones US Life Insurance Index
$DJUSES - Dow Jones US Real Estate Services Index
$DJUSBK - Dow Jones US Banks Index
$DJUSIB - Dow Jones US Insurance Brokers Index
 
Last edited:
Re: Stockcharts - Mansfield

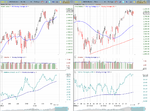
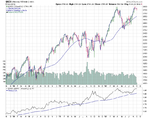
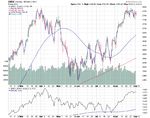
Hi again vali, I've had a play with the freestockcharts platform and have managed to get it set up similar to my charts on here. I've attached the screenshot so anyone can copy the settings.

Also attached is the same weekly and daily charts in stockcharts, which lets me overlay the price line as well which I think really helps to identify the chart patterns, as it's easier to see technical formations such as head and shoulders patterns etc imo.
 

Attachments

  • freestockcharts_weinstein.png
    freestockcharts_weinstein.png
    50.3 KB · Views: 332
  • sc-65.png
    sc-65.png
    31.9 KB · Views: 272
  • sc-66.png
    sc-66.png
    38.9 KB · Views: 224
Last edited:
Top