Re: PSTI and STEM - small biotechs
They are definitely dangerous, not only because a failed trial or running out of cash can devastate a small biotech,
but because 1. they are spikey both ways, so it can be hard to place an automatic stop
and 2 they don't act "technically", but shift around only when there is a news item.
Thus they feel to me like "trader" stocks to be used with daily charts, or, even more likely, to be fondly viewed by the day trader who looks for pre and post market action etc.
Nevertheless, if you can work with a mental stop (or guaranteed stop if you must), and bet a very small amount, I can't see why they can't be a bit of spice.
I can see the news case for both these stocks,
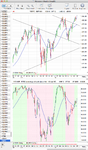
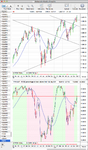
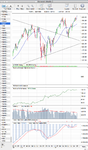
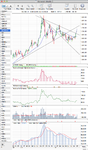
but in both these cases from an investor perspective, I think the main breakout from stage 1 is lower down,
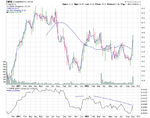
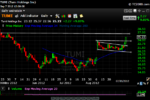
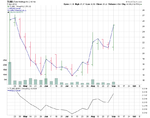
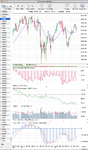
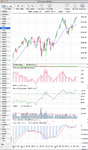
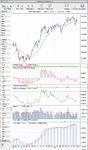
at about $3 on PSTI - 18 month weekly - StockCharts.com
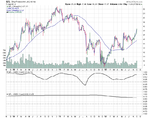
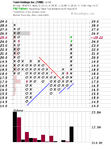
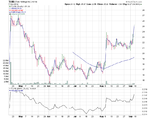
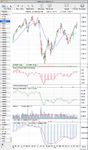
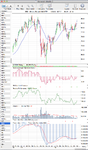
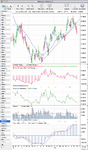
and about $1.15 on STEM - 18 month weekly - StockCharts.com
(and are now starting to hesitate into potential stage 3s).
From these breakouts they have actually continued up significantly, so that is why I think in principle these small-priced biotechs need not be ignored.
(Myself I don't bet on them, as I am cautious, but I look at them as they often show extreme chart patterns.)
In the book I couldn't find any reference to market cap and sectors-to-avoid. Are there any?It's a very dangerous game playing the small penny pharma stocks imo . . ..
They are definitely dangerous, not only because a failed trial or running out of cash can devastate a small biotech,
but because 1. they are spikey both ways, so it can be hard to place an automatic stop
and 2 they don't act "technically", but shift around only when there is a news item.
Thus they feel to me like "trader" stocks to be used with daily charts, or, even more likely, to be fondly viewed by the day trader who looks for pre and post market action etc.
Nevertheless, if you can work with a mental stop (or guaranteed stop if you must), and bet a very small amount, I can't see why they can't be a bit of spice.
I can see the news case for both these stocks,
but in both these cases from an investor perspective, I think the main breakout from stage 1 is lower down,
at about $3 on PSTI - 18 month weekly - StockCharts.com
and about $1.15 on STEM - 18 month weekly - StockCharts.com
(and are now starting to hesitate into potential stage 3s).
From these breakouts they have actually continued up significantly, so that is why I think in principle these small-priced biotechs need not be ignored.
(Myself I don't bet on them, as I am cautious, but I look at them as they often show extreme chart patterns.)