US Treasuries Stage Analysis
Attached are the marked up charts of the US 30 year Treasuries (US) futures and US 10 year Treasuries (TY) futures, and although both are very similar I find it useful to look at both to provide confirmation for each other.
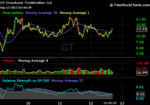
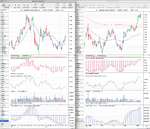
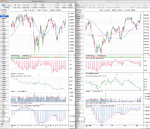
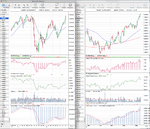
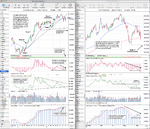
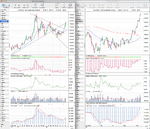
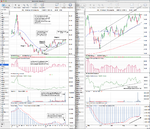
US 10 year Treasuries (TY)

The weekly chart moved into Stage 3 five weeks ago and found support at the top of the previous range around the 131 level. It rallied back to below the two year trend line but rolled over again and this week moved back towards the swing low and could possibly break down into Stage 4A if support doesn't hold for a second time.
The Mansfield RS is negative and has moved below the March low signalling weakness, and the straight Relative performance versus the S&P 500 has broken below the two year trend line, indicating a longer term shift in favour of equities.
The weekly cumulative volume gave a sell signal five weeks ago.
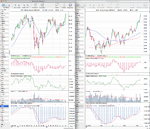
The daily chart shows the second break below the 200 day MA, and so if it closes below 131, then it will move into Stage 4A. However, it could also make a double bottom and continue into a larger Stage 3, but the technicals suggest weakness, so we need to wait for confirmation.
Daily cumulative volume has also given a sell signal, but it hasn’t broken below the August levels yet although all the money that went in during the June/July part of the continuation move has come out again.
If it does break down into Stage 4A then the swing target would be around 127.
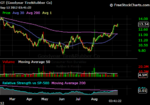
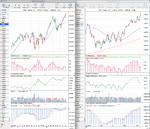
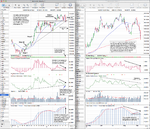
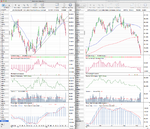
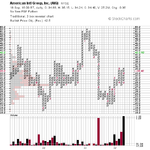
US 30 year Treasuries (US)

The weekly chart has moved into Stage 3 with the close below the two year trend line and first horizontal support. However, there is significant support below from last years range so a move down to 135 is possible.
The 30 week weighted moving average has turned negative.
The weekly Mansfield RS is negative and has moved below the March low signalling weakness and the straight relative performance versus the S&P 500 has broken below it's two year trend line indicating a longer term shift to equities as in the 10 year chart.
The cumulative volume has given a new sell signal this week. Although it’s only a weak one currently, as it would need to break the March low to show that money is flowing out of 30 year treasuries.
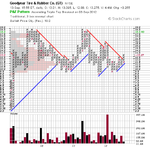
The daily chart shows the breakdown into Stage 3A with the lower high and break below the previous swing low. The price closed right on the 200 day MA, which could provide support. However, once a swing low has formed below the 200 day MA, then that will be the level to watch for a breakdown into Stage 4A. But it could also pivot here as the 10 year did five weeks ago around the 200 day MA and horizontal support, but the technicals are weakening still suggesting a move lower is more probable.
If it does break down into Stage 4A then the swing target would be around 139.
So both of the Treasuries charts are now in Stage 3 after making head and shoulder patterns during their summer Stage 2 continuation moves. The technical picture is weakening for both, although the 10 year is more advanced in Stage 3 and close to breaking down. So these are key charts to watch, as if they do breakdown into Stage 4 then it will give further confirmation to the equity rally and send stocks higher. But if the support levels hold and they instead continue in Stage 3 then it will be harder for equities to advance.
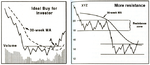
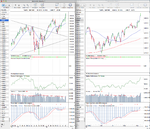
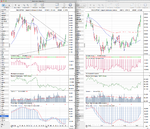
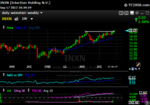
Finally, attached is the relative performance chart between the ETFs of the S&P 500 (SPY) and 30 Year Treasuries (TLT) which shows the recent breakout of the two year trend line in favour of equities, but also that there's some immediate resistance to work through to consider.