Stan Weinstein's Stage Analysis

Re: QCOR - sell point

Thanks isatrader for the analysis. To me, the lower low below the trendline is the key feature. I notice you have drawn the trendline to the bottom of the lower low, so you have drawn it like on chart 6-3 Alfin page 166 and chart 6-18 IBM page 178. With chart 6-12 Anacorp and 6-19 Central Hudson, however, Weinstein draws the trendline to the lower low only if it happens to coincide with the trendline. On charts 6-6 Rochester and 6-7 Chase Manhatten, pages 169-170, though, the lower low happens to be below the trendline, and I see QCOR as like those.
I suppose this is the problem with using trendlines, that it is a less exact method than using horizontals.
Thanks again.

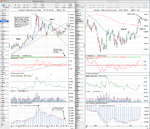
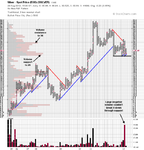
For the trend lines I use the weekly closing prices instead of the intraday lows as I find personally that they are more significant. But a valid trend line needs to have at least 3 touch points I believe, but it is more of an art than a science, as everyone will draw them slightly different. So don't be too rigid with breaks above or below them unless it starts closing above or below them and doesn't recapture the broken trendline.

Ok, I'm off to London now, as I'm having laser surgery on my eyes this morning, so I might not be able to post for a few days as I don't think I'm allowed to use a computer for 3 or 4 days. Have a good weekend.
 
Last edited:
PDLI long

To balance the QCOR short I have found a promising dividend-paying biotech. It broke at $6.75 a week or so ago (on no particular news story), and so the strategy is to look for a good pullback from the $7.50 Jan 2010 resistance.
(Stockcharts have an erroneous chart, so am trying chartmill again.)
http://img832.imageshack.us/img832/2518/pdliweekly.png
 
Last edited:
Hey Isa and everyone-

First day on T2W and found it by researching Mr. Weinstein. So happy to see there is already 58 pages of discussion and ideas from you all. I will try and read through in the next few days as to not ask too many redundant questions. About me- just getting into the game and was inspired by Stan (obviously). Looking to learn/discuss and even help when i possibly can. Thanks to isa for starting this thread!

Mike

P.S. Hope your eyes are better soon-
 
Hi LockedIn. In isatrader's absence, I'll say hi.
So you can read the book with questions in your head, the points of discussion included in the thread are:
Setup: the actual break point (up or down)
should volume occur before, during, or after (or all 3!)
should we stick to horizontals and not bother with trendline breaks
sectors - "forest to trees" - is this always necessary?
moving average - few free packages have "weighted". Can we use simple or exp instead?
managing the position, esp stage 3
Software: can you get by on free software
Scanning for stocks: ditto, and where. Use of subscription services.
Timing the trade: immediate v can we delay, buying highs v waiting for pullbacks
Stops and targets
Trader v Investor
Can it be used on sectors (through ETFs) commodities, currencies, and global stockmarkets, and how

(I usually chip in on these topics, but isatrader studies this diligently, so is 99% likely to be right - make that 100% !)
Listen to the interviews with Weinstein; and there are also a couple of videos early on by isatrader.
I throw in some stock suggestions, but I am four weeks late usually, so take my ideas with a pinch of salt !
 
Last edited:
Re: AAPL - CHS Chico's - question on volume

If you look at the ideal volume chart on page 104 in the book, you'll see that the volume doesn't have to pick up until the stock breaks out, and so you don't need to consider it when finding your picks that are close to the breakout point. The way I play it personally, is that I do my due diligence to make sure everything else is in place for the method and then I buy the stock on the daily close above the breakout point. I then use the volume over the following weeks as a confirmation signal, as if it doesn't build strongly with the breakout as the method requires, then I'll just take a quick profit or trail the stop, as without the volume it's more likely to just be a mediocre pick that's less likely to continue too much higher.

So don't be too rigid with the volume as it takes time to show and is why I use the cumulative volume as it's easier to read I find. I suggest if the volume is strong on the daily chart when you get the daily close above the breakout level, then that's good enough to get in if everything else looks right. As remember, in the book he says to use buy-stop orders to get in, but I think this has changed over the years, as I remember him talking on one of the interviews about waiting for a confirmation of a close above the breakout level now.
Important thoughts, thanks isa. Vol is also item 1 on p150 on he Triple Confirmation Pattern in Uncovering Exceptional Winners I'm seeing some breakouts, but not much volume to accompany, whether before, during, or after, even on AAPL - weekly - StockCharts.com
 
Last edited:
Hi LockedIn. In isatrader's absence, I'll say hi.
So you can read the book with questions in your head, the points of discussion included in the thread are:
Setup: the actual break point (up or down)
should volume occur before, during, or after (or all 3!)
should we stick to horizontals and not bother with trendline breaks
sectors - "forest to trees" - is this always necessary?
moving average - few free packages have "weighted". Can we use simple or exp instead?
managing the position, esp stage 3
Software: can you get by on free software
Scanning for stocks: ditto, and where. Use of subscription services.
Timing the trade: immediate v can we delay, buying highs v waiting for pullbacks
Stops and targets
Trader v Investor
Can it be used on sectors (through ETFs) commodities, currencies, and global stockmarkets, and how

(I usually chip in on these topics, but isatrader studies this diligently, so is 99% likely to be right - make that 100% !)
Listen to the interviews with Weinstein; and there are also a couple of videos early on by isatrader.
I throw in some stock suggestions, but I am four weeks late usually, so take my ideas with a pinch of salt !

Thanks lplate, I'm very humbled by your kind words :eek:

Welcome to the discussion Locked in. I hope you find the thread useful and it will hopefully help you follow on with your studies of the method in more depth once you've finished the book.

My eyes are still pretty awful from my laser surgery last week, so I can't be on the computer for very long. But it looks like lplate has done a good job of summing up a lot of what we've covered in the thread.

There are numerous examples throughout the thread to help learn how to identify the stages, but for the main stage examples to study, you can find them on page 3 from here:

http://www.trade2win.com/boards/technical-analysis/134944-stan-weinsteins-stage-analysis-3.html#post1695880

And multiple newer examples from this year on page 41 from here:

http://www.trade2win.com/boards/technical-analysis/134944-stan-weinsteins-stage-analysis-41.html#post1804190
 
... My eyes are still pretty awful from my laser surgery last week...
Hope the op went OK. Take it easy.
Dead market is waiting for Big Ben to speak. There'll be no QE3 yet, and I'm not sure if market has twigged this, so it's not a time to shop for stocks and commods yet, as Sept will be disappointing. It's a great time to rest your eyes and refresh the mind.
 
Hope the op went OK. Take it easy.
Dead market is waiting for Big Ben to speak. There'll be no QE3 yet, and I'm not sure if market has twigged this, so it's not a time to shop for stocks and commods yet, as Sept will be disappointing. It's a great time to rest your eyes and refresh the mind.

The op went well, thanks. But recovery is not fun from Lasek, as they take off the surface of your eyes and so they are fairly traumatised and slow to recover as the protective layer on the surface of the eye has to grow back. So everything is still quite blurry and my eyes are very sore and hurt every time I blink. So have been doing lots of sleeping.

I think you're definitely right about QE, but I am less certain on September as think after the initial reaction that it will be seen as a positive for stocks in the longer run, so am holding onto my positions until everyone gets back from their summer holidays and the volume returns and we get some more clarity.
 
Gold (GC) Stage Analysis

I bought back into Gold and Silver a few weeks ago, so I thought it would be good to do an updated stage analysis as they are interesting charts.

The weekly Gold (GC) chart is currently in a larger Stage 3 formation that has developed over the last year. However, the break above the 30 week WMA could possibly be the beginning of a new Stage 1A after it failed to break down into Stage 4 in May/June. Price is now currently testing the one year closing downtrend line, and a break above 1680 would give a possible long traders entry for a test of last years lower highs up to the 1800 level.

The long term monthly Gold chart continues to be in Stage 2B. In the last 10 years it’s only gone into Stage 3 once during 2008. However, the consolidation of the last year hasn’t turned the moving average flat or down, and so the 10 year bull continues currently. The cumulative volume is very encouraging, as very little money has come out over the last years consolidation period.

I've also attached the P&F chart as it shows the areas of volume resistance, of which 1680 is the key level to break above.
 

Attachments

  • Gold_Weekly_29_8_12.png
    Gold_Weekly_29_8_12.png
    141.8 KB · Views: 394
  • Gold_Monthly_29_8_12.png
    Gold_Monthly_29_8_12.png
    72.1 KB · Views: 344
  • Gold_PnF_29_8_12.png
    Gold_PnF_29_8_12.png
    30.4 KB · Views: 334
Silver (SI) Stage Analysis

The weekly chart is currently in Stage 1A after a year in Stage 4 following last Septembers breakdown. Price has broken out from the year long downtrend after failing to breach the four year old uptrend line which is converging with the shorter term downtrend. Cumulative volume gave a new weekly buy signal a few weeks ago and price has got back above the 200 day moving average and made a swing high at 31.225. Therefore a short term traders entry would be to play a continuation move above that imo.

The monthly silver chart has been mostly in Stage 2 since 2003, Although it briefly broke down into Stage 4 during 2008’s sharp sell-off, but recovered strongly back into Stage 2 and pushed to new highs in 2011 on increasing volume. The sell-off over the last year has moved the monthly chart into Stage 3 again, with price currently just below the 30 month weighted moving average and close to breaking the triangle consolidation pattern.

Cumulative volume had a massive run-up in 2010-2011, but the sell-off hasn’t been very strong, and so although currently on a volume sell signal it could easily reverse back to positive again.

So the longer term picture is currently flat in Stage 3, while the shorter term picture is turning slightly bullish in Stage 1A.
 

Attachments

  • Silver_Weekly_29_8_12.png
    Silver_Weekly_29_8_12.png
    138.7 KB · Views: 343
  • Silver_monthly_29_8_12.png
    Silver_monthly_29_8_12.png
    80.1 KB · Views: 400
  • Silver_PnF_29_8_12.png
    Silver_PnF_29_8_12.png
    28.7 KB · Views: 332
Soybean Meal (SM)

I bought back into Soybean Meal (SM) again today as it made another continuation move to new highs. The cumulative volume and Mansfield RS continue to outperform, but I got out of this one too early back in July after getting in on a continuation move in early April. It was my best trade of the year so far, but I should have been more patient and waited for a Stage 3A exit point.

The recent consolidation has given me a chance to get back in with a reasonable stop loss distance below the 50 day MA, but it is a fair way above it's 30 week MA so it could easily reverse on me as it is quite extended. Although by historical standards it's been much more extended than it currently is multiple times in the past.

Attached is my charts.
 

Attachments

  • SM_Weekly_30_8_12-2.png
    SM_Weekly_30_8_12-2.png
    121.5 KB · Views: 368
Last edited:
Thanks for the warm welcome guys-

After reading through about a third of this thread it has become painfully obvious that I need to up my software game. I am currently on Scottrader and while they do have some indicators (including weighted moving average), they are lacking on others that you all have mentioned (Mansfield cross and force index).

I am very new to the game and can't even put text onto a chart and embed it here (as I just tried on stockcharts).. Do you have a suggestion on what software I should use? Judging by lplate's comment above, I bet you have already discussed this but have not come across it yet in the thread. My apologies-

I was also wondering how you create a list of stocks or sectors (such as post #73 pg 10 of this thread) which include a search for performance vs index, rising MA and trading above the MA. Great info so far by the way. Naturally, I like to compare charts you have analyzed in the past to its current state and it seems like you are doing very well! I am really learning a lot and appreciate it!

For software you don't need anything other than the free software to begin with while you're learning. stockcharts.com, freestockcharts.com or chartmill.com will do the job as minimising trading costs is one of the most important lessons to learn.

Indicators etc are also largely unimportant. For Weinstein's method you just need a weekly chart with a 30 week moving average (a weighted MA is preferable imo, but not essential), volume and the Mansfield relative strength indicator (which is just a relative performance measure versus the S&P 500, that has a 52 week moving average as the base (zero) line. An example from stockcharts of the chart setup is below:

attachment.php


Other indicators such as cumulative force index which you see on my main charts, are my personal custom tools to help me read what I'm seeing more clearly, but you don't need to use them and won't find them in any software programs as it's something I've adapted myself from Elders force index indicator to help me read the volume.

Finally to see a list of stocks by relative strength rankings you can use the free resources on chartmill here: ChartMill.Com | Screener for Stocks on Euronext, Amex, NYSE and Nasdaq Markets. or stockcharts technical rankings table here: StockCharts Technical Rankings - Free Charts - StockCharts.com
 

Attachments

  • sc-56.png
    sc-56.png
    23 KB · Views: 1,366
Last edited:
Thanks Isa- I tried a few out and chartmill seemed to be the best in my opinion. Anyway, I hope I have attached this chart of Las Vegas Sands (LVS) correctly. I wanted to analyze it for two reasons. First, my mother bought it about a year ago...road it up hoping/wishing that it would hit 80...she subsequently road it all the way back down to around the price she purchased it. Reason 2 is that it seems strange going from stage 2 to stage 3 and then back into stage 2 for a nice 20 dollar bump. In listening to one of the interviews with weinstein from last year, he said that this happens about 10% of the time.

I think, but I am not sure, this stock is still in a stage 4 decline despite the current correction. If you take the swing rule, the stock might head down to around 22 before consolidating. I only think this because of the recent support being broken and a lack of any conviction in the volume. Also, the 30 week MA is on the decline with the stock trading below it. RS seems bad as well. I've been telling my mother to sell for months now. Do you guys think my advice is correct?
 

Attachments

  • lvs_Weekly.png
    lvs_Weekly.png
    67.9 KB · Views: 319
Thanks Isa- I tried a few out and chartmill seemed to be the best in my opinion. Anyway, I hope I have attached this chart of Las Vegas Sands (LVS) correctly. I wanted to analyze it for two reasons. First, my mother bought it about a year ago...road it up hoping/wishing that it would hit 80...she subsequently road it all the way back down to around the price she purchased it. Reason 2 is that it seems strange going from stage 2 to stage 3 and then back into stage 2 for a nice 20 dollar bump. In listening to one of the interviews with weinstein from last year, he said that this happens about 10% of the time.

I think, but I am not sure, this stock is still in a stage 4 decline despite the current correction. If you take the swing rule, the stock might head down to around 22 before consolidating. I only think this because of the recent support being broken and a lack of any conviction in the volume. Also, the 30 week MA is on the decline with the stock trading below it. RS seems bad as well. I've been telling my mother to sell for months now. Do you guys think my advice is correct?

I've done a marked up chart of LVS for you of how I see it currently. It's been in Stage 4 since the last day of May / first day of June. However, on a longer term basis it's still within a much larger Stage 3 range that has built up over the last two years, with the exception of the failed Stage 2 continuation move at the start of the year.

On the P&F chart you'll see there's major resistance up to the 46 level, but the major breakdown point for a long term holder would be for it to start closing below 34.

On the daily chart I'd say that a move back below the short term trend line and the 50 day MA would be a good continuation sell signal imo if you were trading it.

Attached is my marked up charts
 

Attachments

  • LVS_Weekly_31_8_12.png
    LVS_Weekly_31_8_12.png
    128 KB · Views: 386
  • LVS_PnF_31_8_12.png
    LVS_PnF_31_8_12.png
    18.9 KB · Views: 330
. . . Las Vegas Sands (LVS) correctly. I wanted to analyze it for two reasons. First, my mother bought it about a year ago...rode it up hoping/wishing that it would hit 80...she subsequently road it all the way back down to around the price she purchased it. . . .
I think you know the answer to your question. Page 164.
I suppose you can make a case for holding it
Why I Doubled My Bet On Las Vegas Sands Recently - Seeking Alpha (though p/e 25 and even the Lazard target is only $48)
but it wouldn't be a Weinstein case.
This is really about managing a position, I think, and the complexity is, as you say, the fast turnaround at the top, so you almost have to switch to daily, where the answer looks pretty clear.
How much does it cost to deal in the States $10? It's nothing. If it was me, I'd get out and get into either something comfortable or something with a good set-up.
 
For software you don't need anything other than the free software to begin with while you're learning. . . . For Weinstein's method you just need a weekly chart with a 30 week moving average (a weighted MA is preferable imo, but not essential), volume and the Mansfield relative strength indicator (which is just a relative performance measure versus the S&P 500, that has a 52 week moving average as the base (zero) line. . . .
I agree with isatrader. This issue arises because Weinstein's own subscription is so darned high.

As far as I can see, there is no proper free scanner code on the web, and all attempts end up trying to achieve the same outcome via a different means (new highs, increased volume, MA crosses, RSI etc). Where they fall down, I think, is that they cannot, without special code, computerise the shape of the stage 1, the style of the breakout and the position of the resistances. In practice, I think, you have to judge this by eye.
What in the end are you trying to produce? If you look for the 100% perfect Weinstein set up, you won’t find it – or maybe one or two per year.
You are therefore using a mental checklist of, say, a half-dozen essential features (for a buy: b/o, over 30 wwma, 30 wwma rising, ManRS rising, volume doubled, b/o was not lower down) and a half-dozen extra desirable but not essential features that you know from reading the book, and then in effect scoring each candidate in your head and selecting those with the essential features and the highest “score”.
What therefore I do is to nevetheless use some sort of free scan available which brings up a big field of candidates and then look at all it produces, chart by chart. I then check the best ones on 3yr wkly stockcharts and, if necessary, on 5yr wkly bigcharts. (You can use chartmill of course also.)
The downside from a professional scan is that it takes a while and I may miss some gems. I don't know, really, without seeing professional outcome and comparing it to mine. As you can see, I am usually days behind, and sometimes weeks behind, so that is another problem.
I would like to see the scan produced by S2O Pro as it is claimed Weinstein has publicised it as an easy shortcut to some of his stocks.

Don't forget this fine fellow, ShareHunter , who has had designed for him some software to bring up the buys in the major SPX, NAS100 and UK FTSE350 He charges per month approx $60 for the US A few years ago he used to offer his software for sale for a substantial but not overbearing amount. Maybe he still does.

PS have you read p3 of the thread, and also Charting software for Stan Weinstein's method - Aussie Stock Forums
subtitled: Isatrader holds his own against the prissy!
 
Re: OXM BONT

I bought back into Gold and Silver a few weeks ago . . . .
Very well done isatrader on Gold and Silver, after their big rise post Ben. Looks like you may be right too - and me wrong - on a bullish September.
Still take it easy, as the long weekend is ideal to relax the eyes. Glad it went well.

Volume has shrivelled, but I have actally noticed one or two candidates.

Best of the week I think , on good results clothes designer and marketer
OXM - Oxford Industries 3yr wkly - StockCharts.com $54.50 b/o $52.50 continuation from IHS stage 3.
We have noticed several stocks in this sector recently, e.g. SKX - Sketchers 3 yr wkly b/o $20 June

On reasonable results, BONT - Bon-Ton - 3yr wkly - StockCharts.com $10.50 b/o $9.70, but who wants a loss-making department store group except a sovereign state with more money than sense? This will be a good test of technicals versus fundamentals.
 
Last edited:
Re: OXM BONT

Very well done isatrader on Gold and Silver, after their big rise post Ben. Looks like you may be right too - and me wrong - on a bullish September.
Still take it easy, as the long weekend is ideal to relax the eyes. Glad it went well.

Volume has shrivelled, but I have actally noticed one or two candidates.

Best of the week I think , on good results clothes designer and marketer
OXM - Oxford Industries 3yr wkly - StockCharts.com $54.50 b/o $52.50 continuation from IHS stage 3.
We have noticed several stocks in this sector recently, e.g. SKX - Sketchers 3 yr wkly b/o $20 June

On reasonable results, BONT - Bon-Ton - 3yr wkly - StockCharts.com $10.50 b/o $9.70, but who wants a loss-making department store group except a sovereign state with more money than sense? This will be a good test of technicals versus fundamentals.

Another one in the same group you might not have seen, but is very close to another continuation after consolidating following a continuation move that had good volume in July and is the strongest long term in the US Clothing group is UA: UA - SharpCharts Workbench - StockCharts.com

Thanks on the Gold and Silver. I'm pleased with them so far, as Gold has made a 2.66% ATR(200) move and Silver has made a 3.65% ATR(200) move from where I bought in on the 14th Aug. Friday's closes for both metals gave trader continuation entry points imo, as I mentioned to watch for in my write ups on page 59 a few days back here: http://www.trade2win.com/boards/technical-analysis/134944-stan-weinsteins-stage-analysis-59.html#post1955206

P.S. I can't believe you found that thread on Aussie stock forums. It made me laugh reading it again as that guy really annoyed me. It's a sad state of affairs that you have to justify yourself for being helpful these days.
 
Last edited:
S&P 500 Momentum

It's been a while since I updated the momentum charts, but it's shows a mixed picture currently with the Momentum Index (which is the 200 day moving average of the NYSE advance decline figures; pages 283-287 in the book) trading sideways during this recent price run-up.

My personal momentum indicator (blue chart) which measures the speed of the 30 week weighted moving average went back onto a buy signal on 27th July on the weekly chart, but the daily shorter term momentum went to a sell on the 22nd August, so again a mixed picture.

Finally, the Distance from the 30 week WMA is still in the Bull Neutral zone between 0% and 5% and needs to move above 5% again to go back to Bull Confirmed status imo.

The major breadth indicators that I follow in my other thread here: http://www.trade2win.com/boards/technical-analysis/147476-market-breadth-7.html#post1957524 are more positive though, so with the mixed picture on the Momentum index and bullish tone on the major breadth indicators and the fact that we have yet to break out of Stage 3 means I'm leaning towards being cautiously bullish at the moment personally. But I'll change that view if the breadth starts breaking down and price starts closing below the 50 day MA and can't recover back above it.
 

Attachments

  • SPX_momentum_31_8_12.png
    SPX_momentum_31_8_12.png
    154.4 KB · Views: 299
Last edited:
Top