Re: FRAN - daily chart - trader
Thanks for the thoughts on the topic of breaking through the zero line. (Oddly I notice the "Price" feature on stockcharts does in fact hold its value for all periods, so I must have a think about this again.)
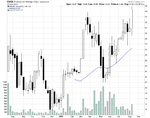
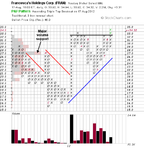
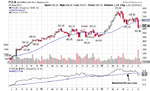
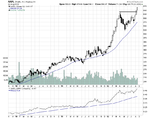
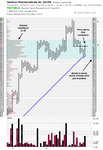
Listed only for a year, so the weekly chart appears just (!) an up-channel, bargain boutique chain Francesca's Holdings FRAN - daily - StockCharts.com looks a Weinstein set up on the basis of a daily chart. Note it tends to retrace after gaps up, so it might retrace after Friday's big move up.
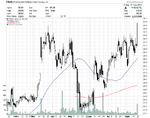
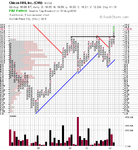
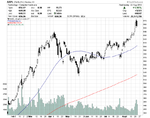
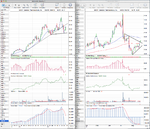
It's in the same sector as Ann Taylor women's wear Ann Inc - weekly - stockchart , which hugely gapped up on results Friday, so there could be momentum in this sub-sector of speciality retail.
Well done on EURGBP.
Thanks for the thoughts on the topic of breaking through the zero line. (Oddly I notice the "Price" feature on stockcharts does in fact hold its value for all periods, so I must have a think about this again.)
Listed only for a year, so the weekly chart appears just (!) an up-channel, bargain boutique chain Francesca's Holdings FRAN - daily - StockCharts.com looks a Weinstein set up on the basis of a daily chart. Note it tends to retrace after gaps up, so it might retrace after Friday's big move up.
It's in the same sector as Ann Taylor women's wear Ann Inc - weekly - stockchart , which hugely gapped up on results Friday, so there could be momentum in this sub-sector of speciality retail.
Well done on EURGBP.
Last edited: