Stan Weinstein's Stage Analysis

Re: Futures Relative Performance

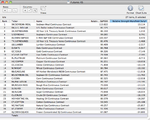
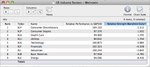
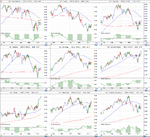
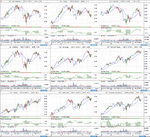
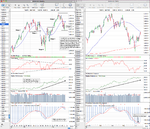
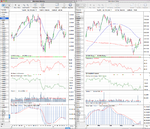
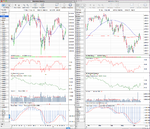
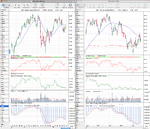
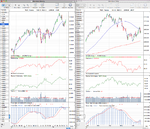
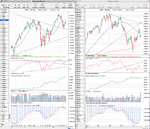
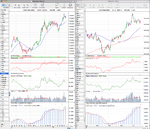
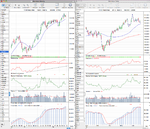
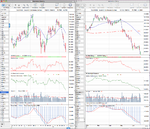
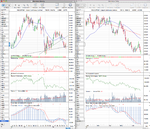
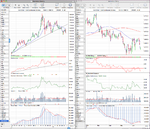
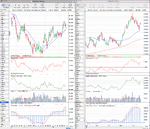
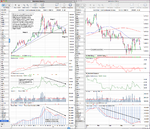
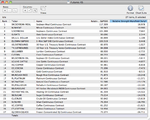
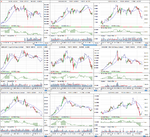
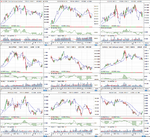
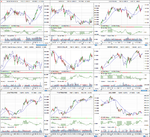
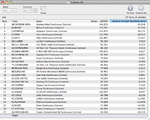
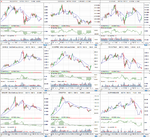
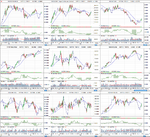
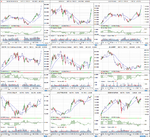
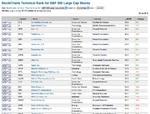
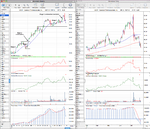
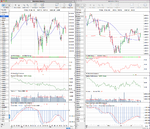
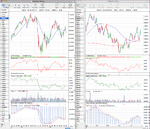
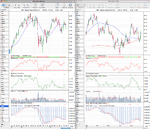
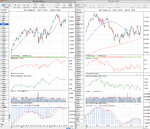
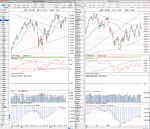
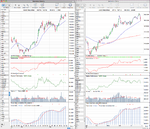
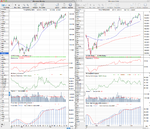
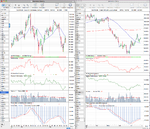
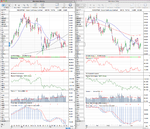
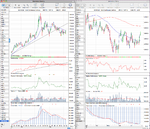
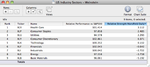
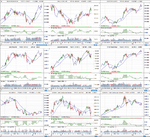
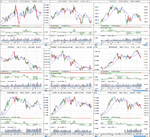
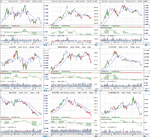
It's been a month since I updated the Futures Relative Performance rankings. Soybean Meal (SM) continues to be the outperformer of the group still by a long way, but the Dollar Index (DX) and 30 year Treasuries (US) have moved into positive territory over the last month, which highlights their largely inverse relationship with equities. The only other outperformer is Soybeans (S) which has mostly held above it's 30 week MA during the pullback and showed good relative strength. All the other futures in the list continue to underperform the S&P 500.

Here's the updated Futures Relative Performance list and attached charts

attachment.php
 

Attachments

  • Futures_Weekly_1_15_6_12.png
    Futures_Weekly_1_15_6_12.png
    131 KB · Views: 293
  • Futures_Weekly_2_15_6_12.png
    Futures_Weekly_2_15_6_12.png
    133.7 KB · Views: 267
  • Futures_Weekly_3_15_6_12.png
    Futures_Weekly_3_15_6_12.png
    124.9 KB · Views: 277
  • Futures_Weekly_list_15_6_12.png
    Futures_Weekly_list_15_6_12.png
    48.3 KB · Views: 2,565
US Industry Sectors

Consumer Discretionary (XLY) is the outperformer of the major US sectors currently, followed by Consumer Staples (XLP), Health Care (XLV), Utilities (XLU) and Technology (XLK).

Financials (XLF) are lagging the S&P 500, but the weekly Mansfield RS is close to going positive so that looks to be the sector to watch currently for a possible entry.

Energy (XLE), Basic Materials (XLB) and Industrials (XLI) continue to underperform.

attachment.php
 

Attachments

  • US_Industry_Sectors_list_15_6_12.png
    US_Industry_Sectors_list_15_6_12.png
    19.7 KB · Views: 2,543
  • US_Industry_Sectors_D_15_6_12.png
    US_Industry_Sectors_D_15_6_12.png
    119.6 KB · Views: 266
  • US_Industry_Sectors_15_6_12.png
    US_Industry_Sectors_15_6_12.png
    121.7 KB · Views: 246
S&P 500 Stage Analysis

It's been a long time since I last did a stage analysis on the S&P 500. But the price action of the last few months has moved it into Stage 3 for the first time since last summer. So I thought it would be useful to look at the stages again.

The move down to find the recent low was more extreme than last years. But price did find support and we now have a Stage 3 range defined between 1422.48 and 1266.74.

The 30 week moving average has flattened and price is currently trying get back above it and also the 50 day MA which can be seen on the daily chart.

The S&P 500 has continued to outperform the broad market index (New York Stock Exchange ^NYA), while weekly cumulative volume has moved to the sell side.The daily cumulative volume is starting to be more positive though and has recently given a buy signal.

Attached is my marked chart
 

Attachments

  • SPX_stages_18_6_12.png
    SPX_stages_18_6_12.png
    135.1 KB · Views: 355
Attached is the latest major charts for analysis. The Dollar index bounced at the previous resistance zone and looks to be making a Stage 2 continuation move. Next major resistance zone is around the 84 to 85 level.
 

Attachments

  • DAX_Weekly_22_6_12.png
    DAX_Weekly_22_6_12.png
    127.5 KB · Views: 257
  • FTSE100_Weekly_22_6_12.png
    FTSE100_Weekly_22_6_12.png
    129.8 KB · Views: 253
  • IWM_Weekly_22_6_12.png
    IWM_Weekly_22_6_12.png
    122.4 KB · Views: 278
  • NDX_Weekly_22_6_12.png
    NDX_Weekly_22_6_12.png
    125.5 KB · Views: 252
  • SPX_Weekly_22_6_12.png
    SPX_Weekly_22_6_12.png
    135.7 KB · Views: 251
  • US_30yr_Treasuries_22_5_12.png
    US_30yr_Treasuries_22_5_12.png
    119.7 KB · Views: 276
  • TY_10yr_Treasuries_22_5_12.png
    TY_10yr_Treasuries_22_5_12.png
    122.2 KB · Views: 262
  • CL_Weekly_22_6_12.png
    CL_Weekly_22_6_12.png
    120.1 KB · Views: 280
  • HG_Weekly_22_6_12.png
    HG_Weekly_22_6_12.png
    126.5 KB · Views: 240
  • GC_Weekly_22_6_12.png
    GC_Weekly_22_6_12.png
    120 KB · Views: 257
  • DX_Weekly_22_6_12.png
    DX_Weekly_22_6_12.png
    122.6 KB · Views: 309
Gold (GC) Stage Analysis

Gold has been in a major Stage 3 range for the last year and it broke down into early Stage 4A in early May when it started closing below it’s 3 year trend line and couldn’t get back above it. However, we are now at a critical level for Gold as the current support level has held on multiple attempts to break it over the last year. But this weeks close was the second lowest and is right on the support line. If it breaks down further here it could break very hard and enter Stage 4 properly.

So it's a critical week for Gold as it could either bounce here again, or break down sharply. Personally I think it will break down and intend to short it below 1550 with a stop loss above the recent highs at 1654.
 

Attachments

  • Gold_stages_22_6_12.png
    Gold_stages_22_6_12.png
    132.4 KB · Views: 284
Re: Stan Weinstein interview


Thanks for finding that lplate. He seems to be doing an interview on there every 3 months or so now to try and tout some business.

It was really useful again to check that I'm the right track with my understanding of the method and he confirmed what I've said on here recently that, the S&P 500 is Stage 3 and Gold is in early Stage 4. So I'm pleased with that.

It was funny at the end of the interview when he talked about people emailing him after the last interview for a copy of the GTA for free. I unashamedly did that and told him I couldn't afford it yet, but hoped to in the future and know a few others from this thread that did too. But I think it was well worth it, as I've used those GTA freebies to help confirm my understanding of the stages and have shared the examples on here for all of you. See page 41 of the thread here for multiple examples of the stages from those GTA reports: http://www.trade2win.com/boards/technical-analysis/134944-stan-weinsteins-stage-analysis-41.html#post1804190
 
Futures Relative Performance

The commodities have seen a turn around the last few weeks and now four softs are outperforming the S&P 500.

Wheat (W) and Oats (O) have made strong moves and Wheat made a Stage 2A breakout this week closing above the 724.5 recent high made in May. The 50 day and 200 day moving averages have also had a positive crossover and the 30 week MA has turned up. So it's looking more promising that Wheat could grind higher. Oats have had a volatile base and a failed Stage 2 breakout in March that rolled over to form a larger Stage 1 base. It's now in Stage 1B again and a weekly close above 351 would make it Stage 2 again imo.

Soybean Meal (SM) and Soybeans (S) continue to be positive and are both attempting to make a Stage 2 continuation move above their highs.

The Dollar Index (DX) has pulled back, but it's Mansfield RS is still slightly better than the S&P 500, although this could easily change over the next week.

10 and 30 year Treasuries (US) have fallen below the zero line and are now under performing the S&P 500 again, which is a good sign for equities.

Here's the updated Futures Relative Performance list and attached charts

attachment.php
 

Attachments

  • Futures_Weekly_list_29_6_12.png
    Futures_Weekly_list_29_6_12.png
    48.7 KB · Views: 2,407
  • Futures_Weekly_3_29_6_12.png
    Futures_Weekly_3_29_6_12.png
    124.6 KB · Views: 321
  • Futures_Weekly_2_29_6_12.png
    Futures_Weekly_2_29_6_12.png
    135.6 KB · Views: 371
  • Futures_Weekly_1_29_6_12.png
    Futures_Weekly_1_29_6_12.png
    134.1 KB · Views: 267
Futures Relative Performance

The soft commodities continue to recover, with more of them outperforming the S&P 500 and trading in Stage 2. Soybean Meal (SM) continues to be the best performer and has gone parabolic, which is why I sold out of my personal position in it last week, as it's getting quite vertical. Other Softs in the top 5 now are Wheat (W) and Corn (C) which have both had strong recovery's.

Here's the RS table and the attached are the thumbnail charts in order of relative performance.

attachment.php
 

Attachments

  • Futures_Weekly_list_20_7_12.png
    Futures_Weekly_list_20_7_12.png
    49.4 KB · Views: 1,846
  • Futures_Weekly_3_20_7_12.png
    Futures_Weekly_3_20_7_12.png
    123.5 KB · Views: 411
  • Futures_Weekly_2_20_7_12.png
    Futures_Weekly_2_20_7_12.png
    133 KB · Views: 393
  • Futures_Weekly_1_20_7_12.png
    Futures_Weekly_1_20_7_12.png
    130.4 KB · Views: 341
Hi Isatrader,

Thanks so much for your posts. I am trying to perform Stan's analysis on US markets, using the free resource freestockcharts.com. I am not very sure how to calculate the Mansfield Relative Strength. In his book, Stan describes this as:

"The formula for measuring relative strength is simply the price of a stock (or group average) divided by the price of a market average."

From your charts i can see that your RS seems to be the correct one. Can you reveal your formula?

Thanks

I struggled with that too when I was first researching the method, as that explanation only gives you the straight RS calculation, whereas the Mansfield RS that he uses in the book is a little bit more complicated as it turns it into an indicator. But it's still fairly simple and I found a good explanation of it a while ago on Chartmill. Here's the link:

ChartMill.Com | Relative Strength (explanation)
 
Another free option for US stocks if you can't get the Mansfield RS to work in your software is to use StockCharts Technical Rank for S&P 500 Large Cap Stocks, which they call SCTR. It uses a scale of 0-100 to rank the S&P 500 stocks using their relative strength versus the index. So the strongest stock will have a SCTR score of 99.9 and the weakest will have a zero. You can filter the order by using the arrows in the SCTR heading on the table.

Go to this link: StockCharts Technical Rank for S&P 500 Large Cap Stocks - Free Charts - StockCharts.com
 

Attachments

  • SCTR_23-7-12.png
    SCTR_23-7-12.png
    77.3 KB · Views: 318
Stage 4 Breakdown - QCOR
This is my simple chart - not as good as isatrader's obviously - to check. Also monthly vol is largest since launch.
Questcor Pharmaceuticals Inc BigCharts.com
How does this fit in with the sectors, as Healthcare in isa's June update was positive?
Also, how should we be playing this general sideways chop in the markets over the last few months? Should we stand aside until there is clearer direction?
This is what puzzled me with the recent Weinstein interview, as he said to stockpick, thus dropping the ideas to trade in line with the direction of the stockmarket and the sector.
 
This is my simple chart - not as good as isatrader's obviously - to check. Also monthly vol is largest since launch.
Questcor Pharmaceuticals Inc BigCharts.com
How does this fit in with the sectors, as Healthcare in isa's June update was positive?

I've attached my marked up chart of QCOR to compare. I've made it a logarithmic chart so that the recent moves are put in context with the percentage moves it's had over the last few years. The recent Stage 2 continuation move in June has failed and it's pulled back into the large Stage 3 range that developed over the last year. The Mansfield relative strength has turned negative and cumulative volume has broken down. So a number of negatives for this stock, however, as lplate mentioned it's sector is strong, and is actually the strongest sector currently by the Mansfield ratings, which as we know, would rule it out as a shorting candidate as per Weinstein's methods guidelines.

So I would rate it as in Stage 3B currently, as to become Stage 4A it needs to either break straight down through the major support at $33, or make a swing low in the current range and then break below that.

Also, how should we be playing this general sideways chop in the markets over the last few months? Should we stand aside until there is clearer direction?
This is what puzzled me with the recent Weinstein interview, as he said to stockpick, thus dropping the ideas to trade in line with the direction of the stockmarket and the sector.

I can't remember where it it is in the book, but I believe he mentioned that you can sometimes break the rules for an exceptional case, especially when the market is range bound to help partially hedge you portfolio. So, he may have meant that in the interview if he was talking about people with investor positions. However, I believe he was saying that there are times when the whole market is rising and you can pick almost any stock, but currently as we're in the sideways chop of Stage 3 that you need to be looking for only the most outstanding picks. i.e. that are in the strongest sectors, have the best relative performance versus the market; are showing the volume characteristics and have a little or no resistance to work through. Basically, the cornerstones of the method. So if it's not an A+ candidate, then stand aside.
 

Attachments

  • QCOR_27_7_12.png
    QCOR_27_7_12.png
    112.3 KB · Views: 321
It's been over a month since I last updated the major charts on here, so there's been a few changes. Here's the charts for your analysis:
 

Attachments

  • FTSE100_Weekly_27_7_12.png
    FTSE100_Weekly_27_7_12.png
    131.1 KB · Views: 332
  • DAX_Weekly_27_7_12.png
    DAX_Weekly_27_7_12.png
    127.4 KB · Views: 309
  • IWM_Weekly_27_7_12.png
    IWM_Weekly_27_7_12.png
    124.4 KB · Views: 321
  • NDX_Weekly_27_7_12.png
    NDX_Weekly_27_7_12.png
    123.6 KB · Views: 306
  • SPX_Weekly_27_7_12.png
    SPX_Weekly_27_7_12.png
    130.2 KB · Views: 757
  • US_30yr_Treasuries_27_7_12.png
    US_30yr_Treasuries_27_7_12.png
    119.2 KB · Views: 300
  • TY_10yr_Treasuries_27_7_12.png
    TY_10yr_Treasuries_27_7_12.png
    119.9 KB · Views: 300
  • CL_Weekly_27_7_12.png
    CL_Weekly_27_7_12.png
    122.1 KB · Views: 332
  • HG_Weekly_27_7_12.png
    HG_Weekly_27_7_12.png
    127.5 KB · Views: 312
  • GC_Weekly_27_7_12.png
    GC_Weekly_27_7_12.png
    124.1 KB · Views: 319
  • DX_Weekly_27_7_12.png
    DX_Weekly_27_7_12.png
    123.7 KB · Views: 330
US Industry Sectors

Health Care, Consumer Staples, Utilities, Consumer Discretionary and Technology are all currently outperforming the S&P 500. Basic Materials continues to be the weakest sector. Below is the list in Mansfield relative strength order and I've attached the thumbnail charts.

attachment.php
 

Attachments

  • US_Industry_Sectors_27_7_12.png
    US_Industry_Sectors_27_7_12.png
    120.3 KB · Views: 317
  • US_Industry_Sectors_D_27_7_12.png
    US_Industry_Sectors_D_27_7_12.png
    124.2 KB · Views: 358
  • US_Industry_Sectors_list_27_7_12.png
    US_Industry_Sectors_list_27_7_12.png
    18.8 KB · Views: 1,282
Last edited:
..... The recent Stage 2 continuation move in June has failed and it's pulled back into the large Stage 3 range that developed over the last year. The Mansfield relative strength has turned negative and cumulative volume has broken down. So a number of negatives for this stock, however, as lplate mentioned it's sector is strong, and is actually the strongest sector currently by the Mansfield ratings, which as we know, would rule it out as a shorting candidate as per Weinstein's methods guidelines.

So I would rate it as in Stage 3B currently, as to become Stage 4A it needs to either break straight down through the major support at $33, or make a swing low in the current range and then break below that.
.... I can't remember where it it is in the book, but I believe he mentioned that you can sometimes break the rules for an exceptional case, especially when the market is range bound to help partially hedge you portfolio. ....
currently as we're in the sideways chop of Stage 3 that you need to be looking for only the most outstanding picks. i.e. that are in the strongest sectors, have the best relative performance versus the market; are showing the volume characteristics and have a little or no resistance to work through. Basically, the cornerstones of the method. So if it's not an A+ candidate, then stand aside.
Thanks for your thoughts. I will offer a couple of thoughts:
1. there are places in Weinstein where the neckline might be a trendline, not a horizontal.
Alternatively, it may be that the Weinstein investor method is not in itself a good means by which to play stocks which are fast risers and sudden fallers. As you say, if it is not a short until it is about $30, then it will have already fallen by half from its high of around $60.
2. a sector contains stocks of very varying longevity and strength of fundamentals, especially NASDAQ stocks, so one logic may be that if a stock is falling within a strong sector, and within a rising stockmarket, then that could make it a particularly good shorting candidate (even if the reverse is more questionable).
Because of the diversity within a sector, it may then be that analysis of sectors is useful above a certain market cap, but below that level more subgroup analysys is needed, and we may decide to avoid investing below a certain market cap.
3. nevertheless as Rewardz shows, the Weinstein method puts you on alert that this stock definitely looks sick, and if you held this stock you would be very advised to prepare to sell, if you had not sold already.

PS thank you very much for the invaluable updates
 
1. there are places in Weinstein where the neckline might be a trendline, not a horizontal.
Alternatively, it may be that the Weinstein investor method is not in itself a good means by which to play stocks which are fast risers and sudden fallers. As you say, if it is not a short until it is about $30, then it will have already fallen by half from its high of around $60.

I agree with you on this, and I think QCOR would have only been a trader method pick based on it's Stage 2 continuation breakout in June above $46.84 and so a trader would have had a good chance to take profits before it pulled back. But, if they didn't, then they would have been stopped out by their trader stop which would have been around the $39 level.

2. a sector contains stocks of very varying longevity and strength of fundamentals, especially NASDAQ stocks, so one logic may be that if a stock is falling within a strong sector, and within a rising stockmarket, then that could make it a particularly good shorting candidate (even if the reverse is more questionable).
Because of the diversity within a sector, it may then be that analysis of sectors is useful above a certain market cap, but below that level more subgroup analysis is needed, and we may decide to avoid investing below a certain market cap.

Agreed, sub-sector analysis is very important as well, and you'll generally find some weak stocks even in the strongest sectors. One reason for this could be pairs trading by the hedge funds, or a dominant player in a certain sector taking the majority of the market share from it's competitors. I'm sure there are more examples you could think of a well.

I'd say sector analysis is a good secondary tool that is useful for confirming your individual stock picks and hence giving you confidence to hold them through their Stage 2 moves.
 
Top