isatrader
Senior member
- Messages
- 2,965
- Likes
- 136
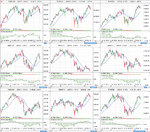
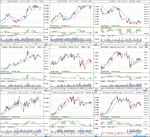
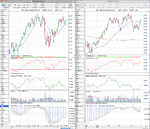
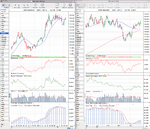
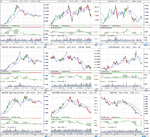
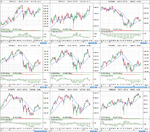
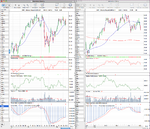
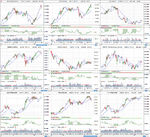
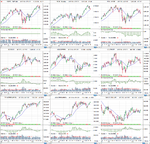
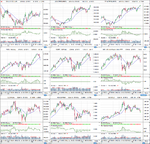
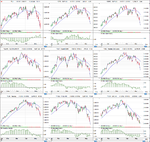
FTSE 350 Sector Relative Performance
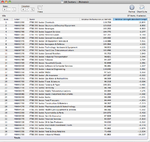
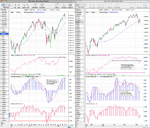
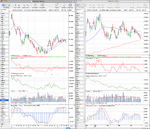
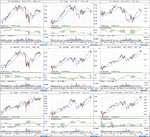
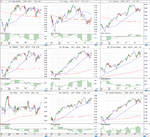
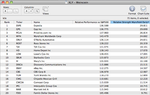
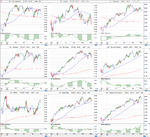
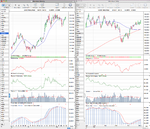
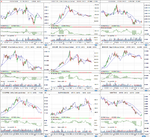
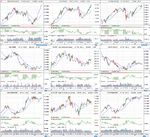
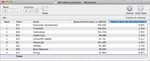
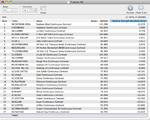
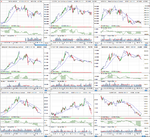
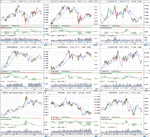
Below is the latest UK FTSE 350 Sectors charts and Mansfield Relative Strength rankings. FTSE 350 Sector Oil Equipment Services & Distribution Index (^NMX0570) dropped from last weeks 1st place down to 7th this week, with FTSE 350 Sector Chemicals (^NMX1350) taking over the top spot.The other mover of note was FTSE 350 Sector Personal Goods which moved from 11th to 5th on the RS rankings.
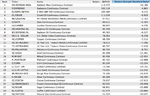
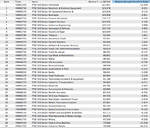
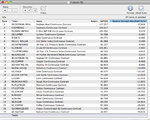
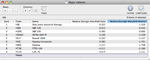
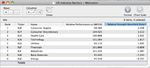
Below is the full list in rank order and attached is the updated charts:

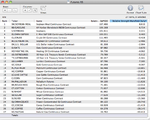
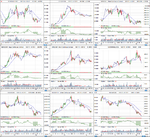
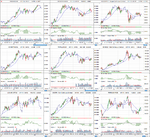
Below is the latest UK FTSE 350 Sectors charts and Mansfield Relative Strength rankings. FTSE 350 Sector Oil Equipment Services & Distribution Index (^NMX0570) dropped from last weeks 1st place down to 7th this week, with FTSE 350 Sector Chemicals (^NMX1350) taking over the top spot.The other mover of note was FTSE 350 Sector Personal Goods which moved from 11th to 5th on the RS rankings.
Below is the full list in rank order and attached is the updated charts: