Stan Weinstein's Stage Analysis

Re: Gold Stage Analysis

Commentators have noted the recent breakdown since 29 Feb in the normal correlation of the $, so it is an unusual goldilocks period, suiting Obama, the US, Europe and China quite well. It won't last, I think, as it is based on hot money, so Stage 4 might never be reached. That is why I might sit out any thought of shorting gold and instead it looks more an opportunity to build up a long-term holding.

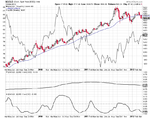
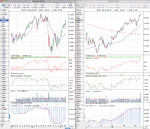
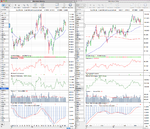
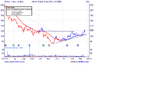
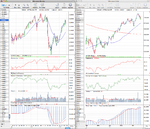
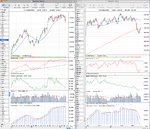
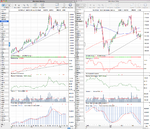
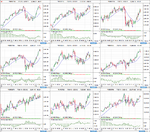
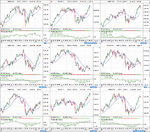
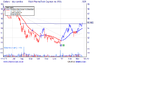
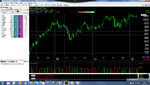
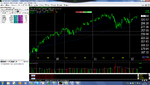
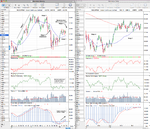
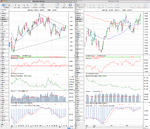
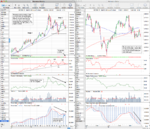
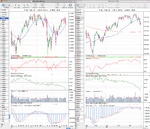
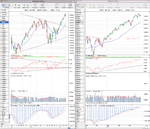
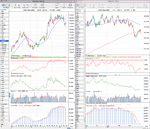
I'd be wary of the commentators that think the correlation with the Dollar since 29 Feb is unusual, as in fact, the normal relationship for Gold and the Dollar is an inverse relationship - which you will see from the long and short term metrics at the bottom on the attached chart. You'll see from the 20 day correlation that it sometimes breaks down and they move together, like in early to mid 2010, but this is not the norm as that's the fear trade. So the fact that the Dollar is rising and Gold is falling is the sign of a more normal market condition.
 

Attachments

  • sc.png
    sc.png
    31.8 KB · Views: 327
Major charts for analysis

The S&P 500 and the Nasdaq 100 continued continued to push to new 52 week highs, but the Russell 2000 Small Caps failed to confirm the move and didn't manage to break out also.

The Dollar Index had more than twice it's normal volume and moved higher before pulling back to close the week slighter lower just above the 50 day MA. This had an effect in the Gold market also, with Gold breaking below it's 200 day MA on the Dollar strength early in the week, but it didn't manage to recover and instead had two inside days and settled very close to it's 3 and half year trend line - as you'll see on the weekly chart. So a big test for Gold this coming week, as a weekly close below the trend line would likely encourage some more selling. But, if it instead reverses and closes back above the 200 day MA, then the buyers may come back in.

Copper still continues to be range bound in the upper portion of it's Stage 1 zone. The 50 day MA and 200 day MA will cross on Monday which is another positive, but it still needs to breakout and have a weekly close above $4 to hit Stage 2A imo. Which would be a further boost to stocks if that happens.

The major move this week though was in the treasuries markets, with the 10 year and the 30 year breaking down and moving into Stage 3. Both closed below their 200 day MA and near the bottom the Stage 3 ranges.

So another interesting week ahead
 

Attachments

  • SPX_weekly_16_3_12.png
    SPX_weekly_16_3_12.png
    120.5 KB · Views: 322
  • NDX_weekly_16_3_12.png
    NDX_weekly_16_3_12.png
    119.7 KB · Views: 309
  • IWM_weekly_16_3_12.png
    IWM_weekly_16_3_12.png
    121.9 KB · Views: 301
  • DAX_weekly_16_3_12.png
    DAX_weekly_16_3_12.png
    121.3 KB · Views: 312
  • FTSE100_weekly_16_3_12.png
    FTSE100_weekly_16_3_12.png
    129.3 KB · Views: 306
  • TY_10yr_Treasuries_16_3_12.png
    TY_10yr_Treasuries_16_3_12.png
    122.1 KB · Views: 316
  • US_30yr_Treasuries_16_3_12.png
    US_30yr_Treasuries_16_3_12.png
    124.1 KB · Views: 315
  • CL_weekly_16_3_12.png
    CL_weekly_16_3_12.png
    127.3 KB · Views: 350
  • HG_weekly_16_3_12.png
    HG_weekly_16_3_12.png
    123.4 KB · Views: 317
  • GC_weekly_16_3_12.png
    GC_weekly_16_3_12.png
    121.2 KB · Views: 328
  • DX_weekly_16_3_12.png
    DX_weekly_16_3_12.png
    119.8 KB · Views: 323
US Industry Sectors

Attached are the latest US Industry Sector Charts. I noted on the 3rd March update that the Financials XLF closed right on it's Stage 2A breakout point, with the Mansfield relative strength improving as well. So with the whole sector moving from Stage 1B to 2A that it was a good time to start looking at individual plays from the group. This has played out well over the last two weeks with Financials leading the move higher and I think is a good example of the method getting you to focus on the right area at the right time, as multiple banking names were showing up in the Stage 1B examples on 2nd March.
 

Attachments

  • US_Industry_Sectors_Daily_16_3_12.png
    US_Industry_Sectors_Daily_16_3_12.png
    120.1 KB · Views: 297
  • US_Industry_Sectors_16_3_12.png
    US_Industry_Sectors_16_3_12.png
    121.6 KB · Views: 310
  • US_Industry_Sectors_list_16_3_12.png
    US_Industry_Sectors_list_16_3_12.png
    25.5 KB · Views: 314
UK FTSE 350 Sectors

There was four Stage 2A breakouts to note this week in the UK FTSE 350 sectors. One was in NMX2350 (FTSE 350 Sector Construction & Materials). So it's a good time to look through the individual names in the sector, which are listed here: Construction & Materials Sector Constituents and another was in NMX8670 (FTSE 350 Sector Real Estate Investment Trusts) which the individual names can be found here: Real Estate Investment Trusts Sector Constituents. NMX8770 (FTSE 350 Sector Financial Services) also moved into Stage 2A and it's individual names can be found here: Financial Services Sector Constituents. Finally NMX8530 (FTSE 350 Sector Nonlife Insurance) is now in Stage 2A and it's individual names can be found here: Nonlife Insurance Sector Constituents

NMX8350 - FTSE 350 Sector Banks moved into Stage 1B and is very close to breaking out into Stage 2A, so it's a good time to look at individual names in that sector as well. Which can be found here: Banks Sector Constituents

Attached are the UK FTSE 350 Sector charts and the list ordered by the Mansfield relative Strength reading as well.
 

Attachments

  • UK_Sectors_list_16_3_12.png
    UK_Sectors_list_16_3_12.png
    89 KB · Views: 372
  • UK_Sectors_1_16_3_12.png
    UK_Sectors_1_16_3_12.png
    105.3 KB · Views: 365
  • UK_Sectors_2_16_3_12.png
    UK_Sectors_2_16_3_12.png
    104.5 KB · Views: 333
  • UK_Sectors_3_16_3_12.png
    UK_Sectors_3_16_3_12.png
    107.4 KB · Views: 303
  • UK_Sectors_4_16_3_12.png
    UK_Sectors_4_16_3_12.png
    104.2 KB · Views: 339
  • UK_Sectors_list2_16_3_12.png
    UK_Sectors_list2_16_3_12.png
    89.6 KB · Views: 424
Last edited:
S&P 500 - Top 9 holdings by market capitalization

The S&P 500 is not an equal weight index, so all of the 500 stocks don't get an equal vote in it's daily movements. Instead, a small number of the largest cap stocks influence how the index moves the most. So I thought it would be a good idea to start following the top 9 holdings by market capitalization as they make up nearly 20% of the index and so will give clues to where it's going to go.

Stage Ratings

Apple (AAPL) - Stage 2B
Exxon Mobil (XOM) - Stage 2B
Intl Business Machines (IBM) - Stage 2B
Chevron (CVX) - Stage 2B
Microsoft (MSFT) - Stage 2B
General Electric (GE) - Stage 2
Procter & Gamble (PG) - Stage 2B
AT&T (T) - Stage 2B
Johnson & Johnson (JNJ) - Stage 3

Attached is the charts
 

Attachments

  • SP500_top9_20_3_12.png
    SP500_top9_20_3_12.png
    109 KB · Views: 348
isatrader thanks so much for the brilliant Thread, I have recently read Stan's book 2 weeks back and found it fascinating. I will post some charts sometime in the future of the South African Market and get your view if I am on the right track, but that's once I have read through your whole tread and been able to build the charting indicators. Keep up the great work.
 
hoe is jy ralph. haven't seen anyone from sa around here? where in southafrica are you? i call myself a bit of a nomad.. at the moment am in uk, but got a place on the market in phalaborwa on a game lodge.
il be interested in sth african chart packages etc etc
 
thought it about ttime i get of my backside and start contributing to this thread. what i intend to do from now on is soon after every buy posting a chart of the trade with a description etc, and keep the thread updated on a regular basis on how the portfolio is doing. the reason i am doing this is if i put it down in a public place it may help me stay disciplined..i do have an annoying habbit of going against my rules from time to time and panic etc, so this may help..also the excercise may prove interesting to others and get some conversation on weinsten methods going. i will point out that i am using my interpretation of the trading method, and may not be by the letter of the book.
i will start the portfolio off with 1000 as of 16/3 and will mirror the percentages with my actual performance. this wee the performance rose 0.21percent while the benchamark sp500 fell 0.51. there were two new entries during the week. home retail, and goldman sachs. the charts are below.
home retail home bought @ 120.9 initial stop 106
goldman sachs gs bought @ 12501 initial stop 11500
the rest of portfolio consists of aap @ 7288, msm 7161, grmn 4075, bac 865, hain 6697,hog 4852, htz 1509.3,bg 6830,
 

Attachments

  • gs.png
    gs.png
    31.4 KB · Views: 312
  • home.png
    home.png
    31.5 KB · Views: 338
Major charts for analysis

Attached is this weeks major charts. Note the 30 year treasuries bounce at the Stage 3 lower support level, which continues to perform in a very technical way. If it continues in this manner, I'd expect a retest of the 140 resistance and then another turn lower to try to breakdown into Stage 4A below 135. And, with it's largely inverse relationship with equities this would likely mean a further pullback this week in the S&P 500 to retest it's breakout level also. This is pure speculation on my part though. However, if it does happen, I'll be looking to put some risk back on in stocks, as some of the money coming out of the treasury market will probably find it's way into stocks instead. But we will see what happens.
 

Attachments

  • FTSE100_weekly_23_3_12.png
    FTSE100_weekly_23_3_12.png
    128.2 KB · Views: 314
  • DAX_weekly_23_3_12.png
    DAX_weekly_23_3_12.png
    119.5 KB · Views: 771
  • IWM_weekly_23_3_12.png
    IWM_weekly_23_3_12.png
    119 KB · Views: 325
  • NDX_weekly_23_3_12.png
    NDX_weekly_23_3_12.png
    118.6 KB · Views: 361
  • SPX_weekly_23_3_12.png
    SPX_weekly_23_3_12.png
    119.8 KB · Views: 786
  • TY_10yr_Treasuries_23_3_12.png
    TY_10yr_Treasuries_23_3_12.png
    118.1 KB · Views: 320
  • US_30yr_Treasuries_23_3_12.png
    US_30yr_Treasuries_23_3_12.png
    120.4 KB · Views: 322
  • CL_weekly_23_3_12.png
    CL_weekly_23_3_12.png
    128.3 KB · Views: 334
  • HG_weekly_23_3_12.png
    HG_weekly_23_3_12.png
    123.7 KB · Views: 322
  • GC_weekly_23_3_12.png
    GC_weekly_23_3_12.png
    122 KB · Views: 335
  • DX_weekly_23_3_12.png
    DX_weekly_23_3_12.png
    120.4 KB · Views: 326
US Industry Sectors

Attached is the US Industry Sectors charts for analysis. Only three sectors have Mansfield relative strength above zero now, which is Tech, Financials and Consumer Discretionary. On an absolute percentage basis, Industrials and Basic Materials are both also slightly outperforming since the October low, but less sectors are now supporting this market.
 

Attachments

  • US_Industry_Sectors_23_3_12.png
    US_Industry_Sectors_23_3_12.png
    121.2 KB · Views: 342
  • US_Industry_Sectors_Daily_23_3_12.png
    US_Industry_Sectors_Daily_23_3_12.png
    115.4 KB · Views: 801
  • US_Industry_Sectors_list_23_3_12.png
    US_Industry_Sectors_list_23_3_12.png
    19.9 KB · Views: 314
UK FTSE 350 Sectors

Attached is the UK FTSE 350 Sectors charts until 23/3/12. Fixed Line Telecommunications (^NMX6530) moved to the top of the relative strength list, and Industrial Metals (^NMX1750) is the weakest sector.
 

Attachments

  • UK_Sectors_4_23_3_12.png
    UK_Sectors_4_23_3_12.png
    104.6 KB · Views: 324
  • UK_Sectors_3_23_3_12.png
    UK_Sectors_3_23_3_12.png
    107.5 KB · Views: 324
  • UK_Sectors_2_23_3_12.png
    UK_Sectors_2_23_3_12.png
    104.5 KB · Views: 301
  • UK_Sectors_1_23_3_12.png
    UK_Sectors_1_23_3_12.png
    105.3 KB · Views: 282
  • UK_Sectors_list1_23_3_12.png
    UK_Sectors_list1_23_3_12.png
    95.5 KB · Views: 386
  • UK_Sectors_list_23_3_12.png
    UK_Sectors_list_23_3_12.png
    96.6 KB · Views: 341
bought two new positions today. both in usa
hcsg @ 2118 with initial stop @ 1990. hcsg is further up the development stage of its trend ansd imo is well into stage 2.for the last 2 months it has formed a triangle pattern and today has started to breakout.

wx @ 1509 with initial stop @ 1380 reson for buying is that its in the strong drugs sector, nd imo the share has formed a base since aug between 10.5 and 15 and today is trying to breakout.

charts below daily, weekly, and sector apologies the weekly hcsg is from telecharts as sharescope data not right...
 

Attachments

  • bus.png
    bus.png
    191 KB · Views: 295
  • hcsg1.png
    hcsg1.png
    206.5 KB · Views: 350
  • hcsg.png
    hcsg.png
    31.7 KB · Views: 353
  • wx.png
    wx.png
    31.2 KB · Views: 282
  • wx1.png
    wx1.png
    29.3 KB · Views: 287
  • drug.png
    drug.png
    188.8 KB · Views: 325
Last edited:
another buy at the end of the day for me as the sp500 looks as though it is going to continue rising for the time being..as of now as long as the index stays above approx 1384.
bought ctxs @ 8017 with initial stop quite a long way away at 7445. imo the weeklt chart is in a stage 2 and when it broke 78 it looked like will move higher. moving to the dailies it passed the 78 level then had a short pullback, before today(at moment anyway) going above the pivot high of 80, so after a bit of dithering as to wether got space for new positions decided to add.. am currently after this addition, 5.05 percent risked and 80percent invested. my risk tolerances allow me to go upto 10percent risked, but as am 80percent invested i wont get anywhere near the ten percent..i will allow myself to move into marging, but with this type of market not substantially.
charts below are weekly, daily, and subsector..
 

Attachments

  • compsoft.png
    compsoft.png
    182.8 KB · Views: 301
  • ctxs.png
    ctxs.png
    33.1 KB · Views: 314
  • ctxs1.png
    ctxs1.png
    30.5 KB · Views: 291
Copper trade

In the spirit of sharing, I added to my Copper trade today at 3.8697, with a stop at 3.6448. Copper has been consolidating in a Stage 1 range for the last few months, moving above and below the 200 day moving average. Cumulative volume has been building since January, but relative performance versus the S&P 500 has been sluggish and has underperformed the last few months. Technically, I think it's shaping up nicely for a potential Stage 2 breakout above $4, so I have been accumulating my position in the Stage 1 range, but it could still break either way here so I have a fairly tight stop below the range.

Attached is the charts. I've added the Copper stock level charts from the LME, as, as you'll see, the draw down in Copper supplies since October 2011 has been continuous and has brought the stockpiles back down to 2009 levels which is a further bullish sign imo, as it adds some improving fundamental evidence to the mix.
 

Attachments

  • HG_weekly_26_3_12.png
    HG_weekly_26_3_12.png
    129.3 KB · Views: 269
  • SharpChartv05-4.png
    SharpChartv05-4.png
    33.5 KB · Views: 284
  • lme-warehouse-copper-1y-Large.gif
    lme-warehouse-copper-1y-Large.gif
    15.6 KB · Views: 310
  • lme-warehouse-copper-5y-Large.gif
    lme-warehouse-copper-5y-Large.gif
    18.6 KB · Views: 219
Last edited:
GBP/USD is in Stage 1B and very close to a potential Stage 2A breakout. I think a daily close above 1.60 would be the Stage 2A breakout imo.

Here's the chart
 

Attachments

  • GBPUSD_weekly_27_3_12.png
    GBPUSD_weekly_27_3_12.png
    123.9 KB · Views: 857
hoe is jy ralph. haven't seen anyone from sa around here? where in southafrica are you? i call myself a bit of a nomad.. at the moment am in uk, but got a place on the market in phalaborwa on a game lodge.
il be interested in sth african chart packages etc etc

Hi Blackmamba, I am based in Johannesburg but have not been to Phalaborwa. I have used three different packages but have found so far MetaStock to be the best for me. South Africa have a number of companies selling software and so some of the software packages have sort of got a bad reputation now because of lack of support after sales.

Look forward to see how I can use MetaStock to create Stan's charts.
 
I've added another two trades. I went short Corn yesterday @ 620.45 as it's still in Stage 4B (possibly early Stage 1A, but the simple MA is still trending down) and made a continuation break below the short term trend line. And today I went long Oats @ 347.97 as it made a Stage 2A breakout yesterday and is displaying excellent relative strength versus it's peers.

I'm also short sugar from a few days ago @ 24.687 which is displaying poor relative strength versus it's peers and continues to move down the futures relative strength matrix.

Attached is the charts
 

Attachments

  • O_weekly_28_3_12.png
    O_weekly_28_3_12.png
    123.4 KB · Views: 312
  • C_weekly_28_3_12.png
    C_weekly_28_3_12.png
    124.2 KB · Views: 300
  • Dorsey-Futures-Matrix.png
    Dorsey-Futures-Matrix.png
    87.9 KB · Views: 224
Last edited:
Gold Stage Analysis

Gold's weekly chart is currently in Stage 3B and this week it has reversed back lower after testing the 30 week MA. The three and half year trend line is very close and a close below that would signal a short term sell signal imo.

The daily chart shows the retest of the 200 day MA this week. However after pushing above it briefly to try to retest 1700, it rolled over and is testing the lower levels again.

Other indicators are adding to the negative evidence as well with 30 week MA, cumulative volume and relative performance versus the S&P 500 all moving lower. Cumulative volume is also diverging from the price action with money leaving gold quicker than the price action is falling.

So we are at a critical point for Gold imo, as if it can't recover strongly back above the 200 day MA then the lower zone of the Stage 3 range could be tested which is why I'm short Gold personally at the moment as the price action seems to suggest it will. But that's just my trade position which might be wrong, so I have a stop at 1722.31 if I am.
 

Attachments

  • GC_weekly_29_3_12.png
    GC_weekly_29_3_12.png
    131.7 KB · Views: 332
US Industry Sectors & Sub-sectors

Attached is the weekly and daily charts of the US Industry Sectors for analysis. I've also included the Dow Jones US sub-sectors - listed by their Mansfield relative strength reading. As this shows which are the strongest and which are the weakest sectors in the market. I'm going to try and keep a weekly list and have a extra column to show the changes in strength each week. Currently it shows:

Top five strongest sub-sectors:
1. ^DJUSCR - Dow Jones US Computer Hardware Index
2. ^DJUSHI - Dow Jones US Home Improvement Retailers Index
3. ^DJUSTT - Dow Jones US Travel & Tourism Index
4. ^DJUSDS - Dow Jones US Industrial Suppliers Index
5. ^DJUSHB - Dow Jones US Home Construction Index

Bottom five weakest sub-sectors:
1. ^DJUSCL - Dow Jones US Coal Index
2. ^DJUSMG - Dow Jones US Mining Index
3. ^DJUSPT - Dow Jones US Platinum & Precious Metals Index
4. ^DJUSPM - Dow Jones US Gold Mining Index
5. ^DJUSAL - Dow Jones US Aluminum Index

The major industry sectors had a few changes to note this week with Health Care (XLV) moving up two positions into fourth place and Utilities (XLU) managed to move off the bottom narrowly moving above Energy (XLE) which is now bottom of the RS table.
 

Attachments

  • US_Sub-sectors_RS_30_3_12.xls
    52 KB · Views: 413
  • US_Industry_Sectors_list_30_3_12.png
    US_Industry_Sectors_list_30_3_12.png
    20.1 KB · Views: 356
  • US_Industry_Sectors_30_3_12.png
    US_Industry_Sectors_30_3_12.png
    119.6 KB · Views: 334
  • US_Industry_Sectors-D_30_3_12.png
    US_Industry_Sectors-D_30_3_12.png
    113.5 KB · Views: 253
Last edited:
Here's my observations on this weeks major charts.

Crude Oil broke down below it's recent range and the 50 day SMA.

Dollar Index appears to be in Stage 2B- with a possible move into Stage 3A as it closed the week below the trend line since the lows, turning the 30 week WMA negative. However, it is still above it's 200 day SMA which will should offer some support if it attempts to move lower from here. But if it does continue lower, it would benefit the commodities and precious metals.

Gold spiked up to test it's 200 day MA, but rolled over under the 1700 level to close the week below the 200 day MA again. But closed slightly higher on the previous week still, so it's holding above the 3 and half year trend line for the time being. The last few weeks price action in Gold has given us a swing low below the 200 day MA which can now be used to define the Stage 4A breakdown level imo, which is a weekly close below 1627.50, as that would also be a close below the long term trend line and the 30 week SMA is negative. It could still recover here though and try to move higher again. But I'm trying not to give a personal opinion, I'm just trying to analyse what the charts are saying based on the method and currently it is that Gold is in Stage 3B.

Copper continues in Stage 1 to bounce around the 200 day MA. It's forming a bit of a triangle formation which can go either way quickly.

Treasuries moved higher as expected last week to try to retest the breakdown levels. The 30 year fell short and closed back below it's 200 day MA on Friday, but the 10 year reached the 130 breakdown level and was rejected on Friday but closed above it's 200 day MA. Both are in Stage 3 and have defined their Stage 4A breakdown levels over the last few weeks. For the 10 year a weekly close below 127.7188 and the 30 year a weekly close below 135.1562 should do it. As noted before Treasuries have a largely negative correlative with equities, so if a Stage 4A breakdown did occur then stocks would likely benefit.

Finally the stock indexes. The S&P 500 closed the week slightly higher after an indecisive week in either direction. The Nasdaq 100 closed very slightly higher, but it was down for the final 3 days of the week. The Russell 2000 small caps also closed very slightly higher, but was down for the final 4 days of the week and the DAX and FTSE 100 were down on the week. So there wasn't much follow through after Mondays move higher, which could be down to profit taking at the end of a very strong quarter or it could be something else. But the price action suggests caution imo, as the indexes are all in Stage 2B and Monday is the start of a new quarter. So the chances of sector rotation and a short term trend change are increased imo.
 

Attachments

  • FTSE100_weekly_30_3_12.png
    FTSE100_weekly_30_3_12.png
    126.3 KB · Views: 298
  • DAX_weekly_30_3_12.png
    DAX_weekly_30_3_12.png
    119.4 KB · Views: 817
  • IWM_weekly_30_3_12.png
    IWM_weekly_30_3_12.png
    117.7 KB · Views: 303
  • NDX_weekly_30_3_12.png
    NDX_weekly_30_3_12.png
    116.8 KB · Views: 294
  • SPX_weekly_30_3_12.png
    SPX_weekly_30_3_12.png
    119 KB · Views: 849
  • GC_weekly_30_3_12.png
    GC_weekly_30_3_12.png
    120.4 KB · Views: 270
  • HG_weekly_30_3_12.png
    HG_weekly_30_3_12.png
    123 KB · Views: 266
  • CL_weekly_30_3_12.png
    CL_weekly_30_3_12.png
    128 KB · Views: 258
  • US_30yr_Treasuries_30_3_12.png
    US_30yr_Treasuries_30_3_12.png
    121.2 KB · Views: 313
  • TY_10yr_Treasuries_30_3_12.png
    TY_10yr_Treasuries_30_3_12.png
    119.9 KB · Views: 288
  • DX_weekly_30_3_12.png
    DX_weekly_30_3_12.png
    120.8 KB · Views: 198
Last edited:
Top