Simple strategy with 3 indicators: +25% Profit last week on USD/CHF

FTT59

Member
Messages
89
Likes
2
Hello

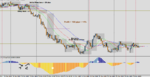
Here is a very simple strategy:
3 indicators based on Bill Williams indicators (on MT4)
You can trade any pair, any TF

You trade the breakout off the box in a direction of the 4 time higher TF

Simple money management rules

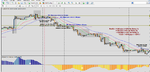
Please check this example from last week on USD/CHF H1:

http://forextrading-tips-advices.blogspot.fr/p/examples-of-trade.html

Let me know what you think

Cheers
 

Attachments

  • usdchf-h1-7-11 april ve.png
    usdchf-h1-7-11 april ve.png
    52 KB · Views: 1,197

Attachments

  • cherry picking.png
    cherry picking.png
    59.3 KB · Views: 608
why would the previous 2 breaks of the box go unnoticed?

u mean the 2 next breaks? They are a bit late in the move down. the first could have be taken with lower lot size as the ao is close to zl but last one is n't.

thanks for the question
 
u mean the 2 next breaks? They are a bit late in the move down. the first could have be taken with lower lot size as the ao is close to zl but last one is n't.

thanks for the question

no, I mean the two obvious exit points. You have just one exit, right down the bottom on the break of the box, but there are two breaks earlier. why are they not exit points? where I've indicated are identical to just your one exit
 

Attachments

  • cherry picking.png
    cherry picking.png
    59.3 KB · Views: 575
no, I mean the two obvious exit points. You have just one exit, right down the bottom on the break of the box, but there are two breaks earlier. why are they not exit points? where I've indicated are identical to just your one exit

Ah, ok i got it! You may exit:
at the break off the opposite fractal box
at the red line if no divergence
at the green line if divergence
everytime at the close of the candle.
When you loot at H1 AO, its peaking so you don't want to get out to early. As the red line is close to the box, you would exit at the close of the candle crossing the red line as no divergence between price and ao (which doesn't happen in the circle area) or at the break of the box if price above the red line.
After divergence, as the green line is normally ur exit, the aims box upper level is close so i exit at teh break.
 
so, why weren't the two exit points I've marked an exit in your example?

Because no candle has closed above the red line.
Break of the opposite box is only one of the exit.

When you are in a nice move down on H4 (AO peaking south), you dont want to exit too early so you would choose the last exit signals

If you look at H4, its speaks for itself, the price has not even reached the green line.

However, to exit where you circled, is not a mistake, just a bit more protective way

Exit at fractal box is very good when price dropped fast, but when its a nice sweet move down like this, alligator lines are perfect exits
 
Because no candle has closed above the red line.
So they all need to line up, as in each one of your exit criteria must conform to exit?
But where you have mentioned the exit, the candle also has not closed?
I'd also argue that the candle has closed higher than the box in my second example

When you are in a nice move down on H4 (AO peaking south), you dont want to exit too early so you would choose the last exit signals
but you can never really know that its a nice move down, unless in hindsight can you, in which case you need to exit where you can..in your example you seem to have chosen a great example, but this I would argue is in hindsight.

@mike..thanks mate but this is a tortuous exercise so I'll leave it be!
 
Hi again
Last trade example on cable H1: 16 April: +5% Profit (+87 pips)

video of the trade:
http://forextrading-tips-advices.blogspot.fr/p/examples-of-trade.html

any question is welcome
 

Attachments

  • gbpusd-h1-16 april ve.png
    gbpusd-h1-16 april ve.png
    36.6 KB · Views: 572
So they all need to line up, as in each one of your exit criteria must conform to exit?
But where you have mentioned the exit, the candle also has not closed?
I'd also argue that the candle has closed higher than the box in my second example

When i use the break of the box as exit, i dont wait for the close the candle, same when the lines are too far from each other

but you can never really know that its a nice move down, unless in hindsight can you, in which case you need to exit where you can..in your example you seem to have chosen a great example, but this I would argue is in hindsight.

@mike..thanks mate but this is a tortuous exercise so I'll leave it be!

true, we never know, that s why u have to trade the setup. Exit is always tricky, u may chose one signal or another.
Cheers
 
Hi again
Last trade example on cable H1: 16 April: +5% Profit (+87 pips)

video of the trade:
http://forextrading-tips-advices.blogspot.fr/p/examples-of-trade.html

any question is welcome

When you are in a nice move down on H4 (AO peaking south), you dont want to exit too early so you would choose the last exit signals

odd that now you are exiting at the first box break whereas in the last example you don't, then choose to say its a nice move down, now you are in a nice move up and you exit on the first break of the box. This really does look as though you are picking charts to demonstrate a method that you are not actually using yourself.
just my observation of course

yes i use this strategy. This is based on Bill Williams strategy (only aims box instead of the fractals buts its the same principle) so the charts are the same but he mostly trades D1
I m not in a nice move up, Its wave 5 on H4 chart while its wave 3 on USD/CHF H4
but if you choose to exit in the first break of box in H1 Usd/chf for the 1st and 2nd entry, its is 4 +2 = +6%, and to 3rd entry will be +1%
Total = +7% Profit
 
FTT59 - would you say your approach leans more heavily to a discretionary approach than the purely methodological? Your box structure appears to offer you a basis for deciding what constitutes tradeable price action, but the basis upon which you seem to be making operational decisions for both entries and exits are different in every case you have cited so far.
 
FTT59 - would you say your approach leans more heavily to a discretionary approach than the purely methodological? Your box structure appears to offer you a basis for deciding what constitutes tradeable price action, but the basis upon which you seem to be making operational decisions for both entries and exits are different in every case you have cited so far.

entries are break of box of sleeping alligator or first fractal after the price broke the box.
Exits a:
break of box in opposite direction
or close of the green candle if divergence between price and AO
or close of the red candle if no divergence between price and AO
sometime those different exits are close to each other , and according to how the picture looks, you may choose one or the others.
I invite you to read Trading Chaos I and II, & New trading dimensions to get the concept
Cheers
 
M15 cable trade +8% on 6-7th May

Hello


here is a new trade this time on M15
At Francfort open, H4 AO is preaking, and on H1 price already broke the box level and we have an inside bar, we can't enter on H1 so we zoom to M15, an IB on H1 means that alligator gets to sleep in lower TF; On M15 we see that there is a new fractal formed; This would be the 3 rd break already but price has not moved that much and both h4 and H1 alligators line are opening. We enter at the break and price flies; we exit when price breaks the lower level of the fractal box the 7th of may for +82 pips. Our initial SL is below the m15 box = 10 pips. Total Profit: +8%
This is a classical trade on a direction of the HTF;

The picture of the trade:


The video:

https://www.youtube.com/watch?v=_H2k-tpozRI

Cheers
 

Attachments

  • gbpusd-m15-6 may ve.png
    gbpusd-m15-6 may ve.png
    32.7 KB · Views: 328
What sort of time frame are you trading? I have seen your examples with 15min, 1hr.
 
Hello
I trade H1, but when i see something interesting in H1, but SL is a bit high, i may drop to M15 or even M5 to find a setup
Cheers
 
Hello

The trade of the week: 100 Pips (+4% Profit) on AUD/USD H1 on the 19-21 TH May. Please note the typical 1-2 move (wave 1-wave 2) on the ewave (AO).

the video of the trade with explanations:

https://www.youtube.com/watch?v=e2yjQBJkHzc

Cheers
 

Attachments

  • audusd-h1-19 MAY VE.png
    audusd-h1-19 MAY VE.png
    31.9 KB · Views: 329
Top