Purple Brain
Experienced member
- Messages
- 1,613
- Likes
- 180
My apologies, I misunderstood. I thought you were boxing the lowest low and the highest high of the 5-bar set. Entering on a breach of the low on a down trend, the breach of the high on an up trend.
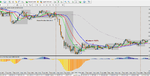
Can you tell me then on aud/jpy yesterday at 16:15 GMT did you have a box with a low at 93.09 and a high at 93.40 or at 93.71?
Can you tell me then on aud/jpy yesterday at 16:15 GMT did you have a box with a low at 93.09 and a high at 93.40 or at 93.71?