154 pips using the Science of Chaos

FTT59

Member
Messages
89
Likes
2
Hi all

Here below is a trade using the Science of Chaos (developped as a strategy by Bill Williams)

The indies:

* The Awesome Oscillator (on MT4) ! It shows the momentum (on my chart i have a elaborated version of the AO).
* The Fractals (on MT4) A fractal is a set of five bars where the third bar is preceded and followed by two lower bars (for high fractal). This frame shows clearly the levels of resistance and support, as well as entry and exit points (on my chart i dont have the fractal but a Fractal Box: This is the gray area between the upper fractal and the lower fractal)
* The Alligator. It consists of three moving averages shown in green, red and blue lines- lips, teeth and jaws. It is intended to help spot trending and rounge-bound markets.

Method in brief:
* Trend following strategy: You enter the market when the trend is confirmed in the higher time frame (for example M5 for trades on M1, H4 for trades on H1)
* Valid on all time frames

Principle:
We enter the market when the price breaks through the fractal Box and when:
* Entry is ok when the trend is confirmed on the higher TF
* The Stop Loss, on the other side of the fractal box, must be close to the entry level
* Entry must be while the Alligator is asleep to get the start of the move
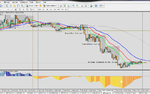
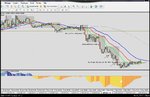
The trade:
The trend is short on H1. We look for an entry on M15. The Alligator is asleep. Our entry is at the first break of the fractal Box (The Stop Loss is at the other side of the Box = 20 pips = 1%). The pice drops then take a pause before dropping again and breaks a new level of the fractale Box (Addon= Second entry with a Stop Loss above the green line at 20 pips = 1%).
Our exit signal, we close the trade at the break of the upper level of the fractal Box for 94 + 60 = 154 pips = 7.7%of profit!

Thanks for watching
 

Attachments

  • gbpusd-m15-1.png
    gbpusd-m15-1.png
    48.2 KB · Views: 817
Pretty looking chart - colourful indicators too.

You wouldn't mind spending time looking at something like that even if you were losing money.
 
I suppose if you enter when the alligator looks as if it has been smashed on the head with a pick axe handle, it's likely to chew your legs off !

Nice trading, lets roll !


:)
 
Hello
Thanks
when the price does not move, there is no difference between the 3 moving average (lines of the alligator) therefore they are intertwined. The alligator is flat, there is no trend. What we like is when we have this while the higher time frame has a confirmed trend
 
I suppose if you enter when the alligator looks as if it has been smashed on the head with a pick axe handle, it's likely to chew your legs off !

Nice trading, lets roll !


:)

Actually after eating many pips, the alligator goes for a nap, the longer it sleeps, the more he will be hungry for pips when he wakes up :)
 
Why didn't you add to the position at the two box breaks I have circled and arrowed? They appear to be identical in structure to the one where you did.
 

Attachments

  • Clipboard01.jpg
    Clipboard01.jpg
    119.5 KB · Views: 399
I also use a 5 bar grouping for highs and lows, but annotate with arrow at the high/low point - your approach looks a lot cleaner.

Do you have or can you point me to the source code for the box drawing indicator?
 
I also use a 5 bar grouping for highs and lows, but annotate with arrow at the high/low point - your approach looks a lot cleaner.

Do you have or can you point me to the source code for the box drawing indicator?

I could addon on the 3rd break (AO has retraced a bit), yes but for the forth, price has gone too far (AO is taller), we want to order while the AO has not peaked.
For the box, i bought the indy along with elaborated AO & alligator (with those dots alarm for entry and exit points)
 
OK thanks for the explanation FTT59.


If there are any MQ4 coding gurus reading this that like to show off and can knock up that box indicator it would be muchly appreciated and in return, I'll let you into my Trading Secret #1.
 
FTT59 - it would be of real interest - if you wouldn't mind - to see how you traded that same pair on the same timeframe using those same indicators today. Could you post up another annotated chart? Cheers.
 
I only ask as finding a system that gets you into the good runs is only half the story. Keeping you out of the chop is the other.

How did your indicators and system work on cable today?
 
I also use a 5 bar grouping for highs and lows, but annotate with arrow at the high/low point - your approach looks a lot cleaner.

Do you have or can you point me to the source code for the box drawing indicator?

Try these for starters.
 

Attachments

  • darvas boxes.mq4
    3.4 KB · Views: 302
  • DarvasBoxes.mq4
    5.6 KB · Views: 283
Hi Purple Brain
i mainly trade H1 in the direction of H4.
Sometime, if i see a setup on H1 but with a sl a bit big, i go down to M15 or M5 if this is a setups as well

I will surely post the other trades using those 3 indicators with the same or with another pair (i trade 8 pairs on H1)

with this system, i trade any TF any chart

However, in average i have 5 signals per pair and per month so patience and discipline are keys!
 
I only ask as finding a system that gets you into the good runs is only half the story. Keeping you out of the chop is the other.

How did your indicators and system work on cable today?

Yes thats why i take trend when i have a confirmed trend on higher time frame to avoid chop (the alligator must be awake)

On cable today: No setup, the H1 break of the fractal box went with the red news (i stay on the sideline during red news) but at that time H4 was still downtrend
 
Thanks for your responses FTT59. Very interesting.

Why did you edit your blog link out of your signature? I was planning on checking it out today.
 
I knew there was something bothering me. Kept going back to your first chart and trying to fathom the source of my discomfort. Now I realise what it is.

The annotated chart you provided indicates entering trades on a breakout of the box. The problem is, the bars you are apparently entering on are part of the fractal that defines the box. [Not sure why it’s referred to as a fractal as it’s not – it’s just a 5-bar swing high or 5 bar swing low sequence.]

In a down trend such as the nice textbook one you used for cable on Nov 1st, the 5-bar setup you're looking for is a bar with two bars each side of it with lower highs. You then use the lowest low of that 5-bar set as the bottom of your box which you would enter on any breakout below. The problem is you’re showing as entering on the bar that constitutes one of the 5-bar set – which is impossible. At best, you could get in on the next bar. Which is fine, in a nice trending pair like that was at that time.

FTT59, there’s another reason you need to be really careful using these AIMS indicators. I don't know how much you paid for them, but in doing a little digging around found that users report significant repaint issues.

All in all, this will work just fine in a strongly trending situation, but then again, everything does in that situation. Where you will get caught out I suspect is not so much when there’s no agreement between the lower and higher timeframes – always a good strategy – but when there is agreement and the action is lumpy rather than flat. You won’t get whipsawed so much as taken in and out for lots of small losses, breakevens and small wins but for the same amount of risk on each trade as you’d post up for a good trade.

How long have you been using these indicators?
 
Hi Purple
The fractal is a set of 5 bars, the fractal is not confirmed until the 5th bars are closed. Once its done your entry is not below/above the 5th bar but below/above the 3rd one. We have fractal high and low, to know what a fractal is, just watch your hand, the middle finger is the higher, the two on the left and and the right lower)
Its not easy to explain in a post the indies in detail. I have been using these indies for 3 years, Bill Williams for 40 years, i would advise you to read BW 's book: Trading Chaos I & II and New trading dimensions.
I never had problem for repaint . Its quite straight forward indicator. I have traded M1 2 years, about 300 candles a day so in 1 day, i had the experience of a D1 trader during 1 year!)
In this strategy, the interest is to be earlier at a start of a wave 3 (ref to Elliott wave). As for the whipsaw, they will happen 80% during wave 4, just dont trade it.
You may have some losing trades (its part of the game) while trying to enter in a wave 3 or 5, especially on M1 and M5 but they will be covered easily as soon as you hit a wave 3 or 5.
One of the secrets to success in trading is to cut the losing trades short and to let the winners run, don't you agree?
Thanks for your interest in this thread
 
Top