Best Thread Market Breadth

Moving Average Breadth Charts - status change

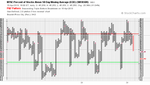
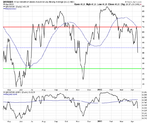
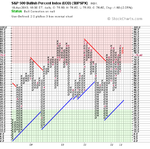
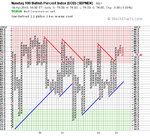
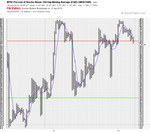
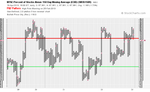
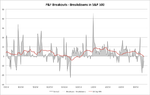
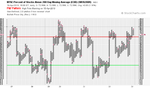
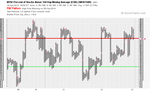
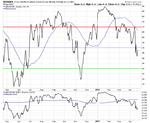
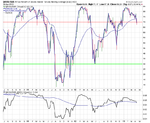
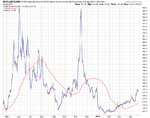
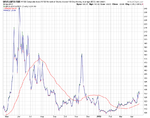
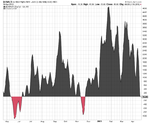
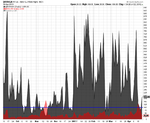
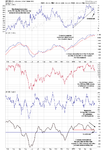
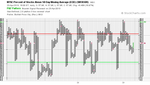
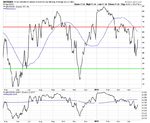
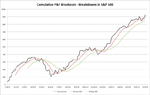
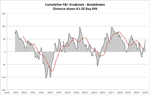
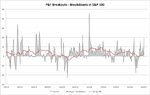
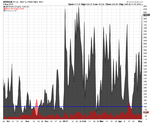
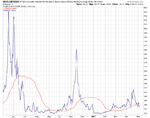
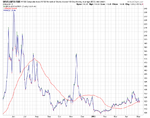
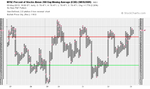
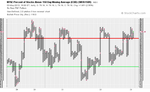
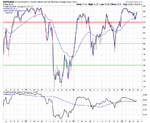
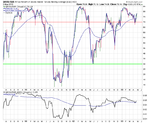
The short term NYSE Percentage of Stocks above their 50 Day Moving Averages chart broke down strongly today to move back to "Bear Confirmed" status. The S&P 500 Percentage of Stocks above their 50 Day Moving Averages chart also moved moved to Bear Confirmed.

attachment.php


attachment.php


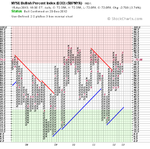
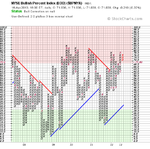
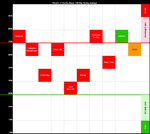
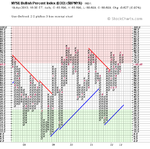
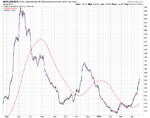
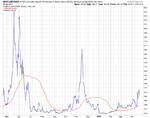
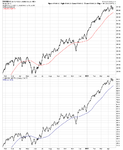
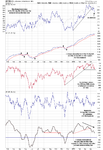
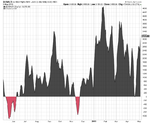
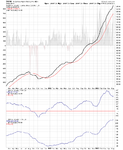
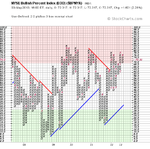
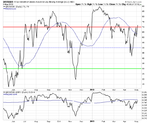
But most notable for me personally in today's big sell off was that the "head coach" - the long term NYSE Bullish Percent Index got within .05 of reversing to a column of Os for the first time since the 20th December. And so there's a good chance of that happening tomorrow if the sell off intensifies.

attachment.php
 

Attachments

  • NYA50R_15-4-13.png
    NYA50R_15-4-13.png
    17.3 KB · Views: 840
  • NYA50R_line_15-4-13.png
    NYA50R_line_15-4-13.png
    35.5 KB · Views: 836
  • $BPNYA_15-4-13.png
    $BPNYA_15-4-13.png
    18.3 KB · Views: 854
New Highs - New Lows

The Daily New Highs - News Lows in the NYSE turned negative yesterday for the first time since November.

attachment.php
 

Attachments

  • NYHL_D_15-4-13.png
    NYHL_D_15-4-13.png
    37.6 KB · Views: 825
top thread.....be interesting to see a right shoulder develop on the NYA50R

especially if the SML index makes a lower higher relative in percentage terms to the SPX
 
NYSE Bullish Percent Index $BPNYA - reversal to defense

I noted yesterday that the long term NYSE Bullish Percent Index ($BPNYA) was very close to reversing to a column of Os (Defense) within overbought territory. Well today even with the market rebounding higher, the NYSE Bullish Percent Index closed below the 72% level and so reversed to column of Os for the first time since December - which puts it on "Defense" in the high risk zone. i.e. Supply is in control of the market and the defensive team is on the field, and so the "head coach" suggests that we now should move into wealth preservation mode.

Dorsey Wright has done a lot of work on the NYSE Bullish Percent Index over the years and came up with a playbook for it which you can get on their website. What it suggests when the Bullish Percent is in the "Red Zone" (above 70%) and on Defense (column of Os) is to:

  • Aggressive Defense
  • Decrease volatility
  • Raise cash levels
  • Reduce exposure to offensive sectors
  • Tighter stops on longs
  • Sell leaders & laggards on breakdowns
  • Buy protective puts to hedge
  • Buy inverse funds to hedge
  • Initiate Short Equity exposure
  • Increase non-correlated exposure

attachment.php
 

Attachments

  • $BPNYA_16-4-13.png
    $BPNYA_16-4-13.png
    18.3 KB · Views: 816
To the person that gave the thread a 1 star rating overnight but didn't post as to why. Can you please explain why you found it so terrible? As clearly you think I'm wasting my time studying the market breadth, so I'd be very interested to see your research as to why you think it's so bad?

Oh, and please post a link to your thread, so I can give an equally impartial rating.
 
S&P 500 Cumulative P&F Breakouts - Breakdowns

There was 0 breakouts and 13 breakdowns today in the S&P 500, which tipped the cumulative breakdowns minus breakdowns line through it's 20 day moving average which I use as a signal line. So it's given a new initial sell signal, which now needs further follow through below the recent swing low for more confirmation.

attachment.php


attachment.php
 

Attachments

  • Cum_SP500_BO-BD_17-4-13.png
    Cum_SP500_BO-BD_17-4-13.png
    22.7 KB · Views: 795
  • Oscillator_SP500_BO-BD_17-4-13.png
    Oscillator_SP500_BO-BD_17-4-13.png
    28.9 KB · Views: 812
Bullish Percent Indexes Reversals

Two more of the major Bullish Percent Indexes have reversed to a column of Os. The S&P 500 Bullish Percent ($BPSPX) and the Nasdaq 100 Bullish Percent ($BPNDX) - which means all four of the major Bullish percents are now on defense.

attachment.php


attachment.php
 

Attachments

  • $BPSPX_18-4-13.png
    $BPSPX_18-4-13.png
    17.6 KB · Views: 802
  • $BPNDX_18-4-13.png
    $BPNDX_18-4-13.png
    17 KB · Views: 803
NYSE Percentage of Stocks above their 150 day Moving Averages

The faster 1 Percent by 1 Box Reversal NYSE Percentage of Stocks above their 150 Day Moving Averages chart continues in it's short term downtrend. The standard 2 Percent by 3 Box reversal chart also dropped another box and is now only 1 box from moving to "Bear Confirmed" status. However, for the time being it still remains on Bear Alert, but is now below the key 70% level for the first time this year. Research suggests that if it drops to 60% that we will usually see the 40% level reached before the 80% level is next reached.

attachment.php


attachment.php
 

Attachments

  • NYA150R_1Box_18-4-13.png
    NYA150R_1Box_18-4-13.png
    28.4 KB · Views: 765
  • NYA150R_18-4-13.png
    NYA150R_18-4-13.png
    18.1 KB · Views: 743
S&P 500 Cumulative P&F Breakouts - Breakdowns

I noted a few days back in the Daily Breakouts and Breakdowns in S&P 500 thread here: http://www.trade2win.com/boards/technical-analysis/147476-market-breadth-31.html#post2115108 that the Cumulative line had broken below the 20 day MA that I'm using as a signal line and so had given an initial sell signal. This continued through to the end of the week with more stocks breaking down than were breaking out with only 10 breakouts to 59 breakdowns in the S&P 500 during the week.

The data I have for this measure only goes back to the beginning of 2012 and so there's only two similar periods to compare against for where it is currently. The first was in April 2012 and the second in late October 2012, and so as both preceded a breakdown within a number of weeks following those points, it seems only sensible to consider it a warning sign here, although it would be averted if the breakouts minus breakdowns reverses back up again to start making new highs once more.

Attached is the updated charts
 

Attachments

  • Cum_SP500_BO-BD_19-4-13.png
    Cum_SP500_BO-BD_19-4-13.png
    23 KB · Views: 194
  • Oscillator_SP500_BO-BD_19-4-13.png
    Oscillator_SP500_BO-BD_19-4-13.png
    29 KB · Views: 190
  • SP500_BO-BD_19-4-13.png
    SP500_BO-BD_19-4-13.png
    34.8 KB · Views: 200
US Industry Sectors Breadth

This week saw big moves in the majority of the sectors lower. Industrials being one of the notable breakdowns as it's been one of the top two for a long time. So a 12.14% drop moves it into fourth on the RS table rankings. Utilities was very slightly higher on the week and so as everything else broke down it's moved into the top spot for the first time since I've been doing these updates.

Basic Materials, Energy and Technology continued to show relative weakness and moved further down their scales, with Basic Materials nearing the lower zone and closing below it's November low.

So the majority of the sectors have now rolled over and are below declining 10 week MAs. The visual diagram shows the current state of the market quite well I think, especially if you compare back over the previous weeks, as it shows the participation is weakening. And the point and figure chart has had a number of double bottom breakdowns with six of the nine sectors on bear confirmed status now.

Below is the data table for the Percent of Stocks Above 150 Day Moving Average in each sector which I've ordered by relative strength, with the highest to the lowest percentage in each sector. Also attached is the visual diagram of the 9 sectors and the overall NYSE Percentage of Stocks above their 150 day Moving Averages, plus the 1% P&F chart and line chart of the nine sectors.

attachment.php
 

Attachments

  • 23_sector-breadth-visual_19-4-13.png
    23_sector-breadth-visual_19-4-13.png
    16 KB · Views: 232
  • sector-breadth-table_19-4-13.png
    sector-breadth-table_19-4-13.png
    17.3 KB · Views: 751
  • US_sectors-breadth_19-4-13.png
    US_sectors-breadth_19-4-13.png
    140.5 KB · Views: 209
  • sector_breadth_1pc_PnF_19-4-13.png
    sector_breadth_1pc_PnF_19-4-13.png
    55.9 KB · Views: 186
Moving Average Breadth Charts Update

Attached is the NYSE long, medium and short term moving average breadth charts and the NYSE Bullish Percent Index.

As I highlighted earlier in the week there have been some major changes to be aware of in the NYSE Bullish Percent Index and the Moving Average Breadth charts, starting with the long term NYSE Bullish Percent Index, which reversed this week to a column of Os and hence moved to a defensive posture within the high risk zone at the top of the chart. The longer term NYSE Percentage of Stocks above their 200 day Moving Averages also moved lower this week to give a high pole warning on the 15th April, which imo moves it to Bear Alert status just above the key 70% level.

The medium term NYSE Percentage of Stocks above their 150 day Moving Averages chart which has been Bear Alert since late February also moved lower and is only 1% from making a double bottom breakdown which would move it to Bear Confirmed status.

The short term NYSE Percentage of Stocks above their 50 day Moving Averages chart has continued in it's downtrend and is now down to 48.29% in a column of Xs, which puts it in Bear Correction status imo after rebounding on Friday. However, it rarely makes a major low at this level and instead usually drops well below the 30% level before a short term bottom is put in, so I expect further downside from here, with bounces along the way.

The three other short term Percentage of Stocks above their 50 day Moving Averages charts (S&P 500, Nasdaq 100 and Dow 30) all ended the week on Bear Confirmed status as you can see in the table below, and so we are seeing much more negative picture from the moving average breadth charts develop, which can also be seen in the line charts for those who don't understand point and figure. With the relative performance of the NYSE Percentage of Stocks above their 150 day Moving Averages line chart versus the S&P 500 closing the week below it's 52 week MA - which is the line in the sand between bullish and bearish relative strength, and so a sell signal from that particular measure also.

attachment.php


attachment.php
 

Attachments

  • $BPNYA_19-4-13.png
    $BPNYA_19-4-13.png
    17.9 KB · Views: 188
  • NYA200R_19-4-13.png
    NYA200R_19-4-13.png
    19.3 KB · Views: 152
  • NYA150R_19-4-13.png
    NYA150R_19-4-13.png
    18.1 KB · Views: 203
  • NYA50R_19-4-13.png
    NYA50R_19-4-13.png
    16.8 KB · Views: 182
  • market-breadth-table_19-4-13.png
    market-breadth-table_19-4-13.png
    12.6 KB · Views: 521
  • NYA50R_line_19-4-13.png
    NYA50R_line_19-4-13.png
    35.6 KB · Views: 198
  • NYA150R_line_19-4-13.png
    NYA150R_line_19-4-13.png
    38.3 KB · Views: 183
  • NYA200R_line_19-4-13.png
    NYA200R_line_19-4-13.png
    36.5 KB · Views: 149
  • ST_MA-breadth-table_19-4-13.png
    ST_MA-breadth-table_19-4-13.png
    13.2 KB · Views: 501
Volatility Breadth Charts

Attached is the updated volatility breadth charts which continued higher again, highlighting the decreasing participation in the market. Most are now back to levels not seen since November 2012.
 

Attachments

  • NYA_BPNYA_19-4-13.png
    NYA_BPNYA_19-4-13.png
    30.1 KB · Views: 176
  • NYA_NYA200R_19-4-13.png
    NYA_NYA200R_19-4-13.png
    34.3 KB · Views: 174
  • NYA_NYA150R_19-4-13.png
    NYA_NYA150R_19-4-13.png
    31.3 KB · Views: 165
  • NYA_NYA50R_19-4-13.png
    NYA_NYA50R_19-4-13.png
    28.1 KB · Views: 181
New Highs - New Lows

Attached is the New Highs / New Lows charts which had a quite negative week dropping below the zero line until Friday's recovery. However, the Total US 5 day total chart ended the week slightly in negative territory for the first time since November, and so is flashing a warning sign at least.

On the cumulative chart, the cumulative line has flattened and the 50 day MA of New Highs minus New Lows continued lower, and even the 200 day MA of the New Highs minus New Lows fattened out a bit. And so the New Highs New Lows charts are in neutral territory currently on Bear Alert imo.
 

Attachments

  • NYHL_Cum_19-4-13.png
    NYHL_Cum_19-4-13.png
    38.7 KB · Views: 199
  • USHL5_W_19-4-13.png
    USHL5_W_19-4-13.png
    31.4 KB · Views: 198
  • NYHL_D_19-4-13.png
    NYHL_D_19-4-13.png
    43.1 KB · Views: 230
Advance Decline Breadth Charts

Attached is the updated Advance Decline Breadth Charts, including the cumulative AD line, momentum index, cumulative AD volume line, 10 Day AD oscillator, NYSE Volume Advancing / Volume Declining Ratio etc.

Notes:
  • Advance Decline Momentum Index - has broken down from its recent range
  • Cumulative Advance Decline Line - the detrended distance above the 200 day EMA chart shows a lower high and three month sideways range of which it's testing the lower part of the range.
  • Advance Decline 10 Day Oscillator - is quite weak still
  • Advance Decline MACD line - has put in another lower high after failing to get back above the breakdown level.
  • Advance Decline Volume - the alternative AD volume measures are showing the same signs as the straight advance decline data, except for the 10 and 30 day MA lines which got very close to a crossover on Friday before it reversed, and so is notably weaker than the straight AD data. This is also true of the AD volume MACD line which is close to crossing the zero line, which is it's major signal line.

So overall the weight of evidence appears to be getting more bearish each week at the moment from the various breadth charts I look at on here, so caution seems to be warranted.
 

Attachments

  • NYAD_NYTV_Cum_19-4-13.png
    NYAD_NYTV_Cum_19-4-13.png
    36.8 KB · Views: 175
  • NYAD_Alt_19-4-13.png
    NYAD_Alt_19-4-13.png
    65.5 KB · Views: 224
  • NYUD_NYTV_Cum_19-4-13.png
    NYUD_NYTV_Cum_19-4-13.png
    47 KB · Views: 208
  • NYUD_Alt_19-4-13.png
    NYUD_Alt_19-4-13.png
    66.9 KB · Views: 196
  • NYUPV_NYDNV_19-4-13.png
    NYUPV_NYDNV_19-4-13.png
    24.8 KB · Views: 202
NYSE Percentage of Stocks above their 50 day MA - status change

The short term NYSE Percentage of Stocks above their 50 day Moving Averages chart has put in a new double top buy signal, moving it back to Buy Confirmed status in the middle of the range. However, the line chart is still in a downtrend below it's own declining 50 day MA, and the relative performance versus the S&P 500 is still below it's 200 day MA as you can see on the chart, so it's not got much confirmation.

attachment.php


attachment.php
 

Attachments

  • NYA50R_23-4-13.png
    NYA50R_23-4-13.png
    17.2 KB · Views: 527
  • NYA50R_line_23-4-13.png
    NYA50R_line_23-4-13.png
    35.3 KB · Views: 519
Last edited:
S&P 500 Cumulative P&F Breakouts - Breakdowns

There was a total of 51 breakouts and 7 breakdowns this week in the S&P 500, which took the S&P 500 Cumulative P&F Breakouts - Breakdowns back to new highs once more. Attached is the updated charts.
 

Attachments

  • Cum_SP500_BO-BD_3-5-13.png
    Cum_SP500_BO-BD_3-5-13.png
    23 KB · Views: 197
  • Oscillator_SP500_BO-BD_3-5-13.png
    Oscillator_SP500_BO-BD_3-5-13.png
    29.5 KB · Views: 181
  • SP500_BO-BD_3-5-13.png
    SP500_BO-BD_3-5-13.png
    36.3 KB · Views: 190
Advance Decline Breadth Charts

Attached is the updated Advance Decline Breadth Charts, including the cumulative AD line, momentum index, cumulative AD volume line, 10 Day AD oscillator, NYSE Volume Advancing / Volume Declining Ratio and the McClellan Oscillator and Summation Index.
 

Attachments

  • NYUPV_NYDNV_3-5-13.png
    NYUPV_NYDNV_3-5-13.png
    24.3 KB · Views: 259
  • NYUD_Alt_3-5-13.png
    NYUD_Alt_3-5-13.png
    64.8 KB · Views: 209
  • NYUD_NYTV_Cum_3-5-13.png
    NYUD_NYTV_Cum_3-5-13.png
    45.6 KB · Views: 267
  • NYAD_Alt_3-5-13.png
    NYAD_Alt_3-5-13.png
    62.3 KB · Views: 207
  • NYAD_NYTV_Cum_3-5-13.png
    NYAD_NYTV_Cum_3-5-13.png
    34.8 KB · Views: 276
  • NYSI_D_3-5-13.png
    NYSI_D_3-5-13.png
    31.6 KB · Views: 182
New Highs New Lows $NYHL

Attached is the New Highs / New Lows charts.
 

Attachments

  • NYHL_D_3-5-13.png
    NYHL_D_3-5-13.png
    44.1 KB · Views: 212
  • USHL5_W_3-5-13.png
    USHL5_W_3-5-13.png
    31.7 KB · Views: 208
  • NYHL_Cum_3-5-13.png
    NYHL_Cum_3-5-13.png
    39.1 KB · Views: 251
Volatility Breadth Charts

Attached is the updated volatility breadth charts
 

Attachments

  • NYA_NYA50R_3-5-13.png
    NYA_NYA50R_3-5-13.png
    28 KB · Views: 249
  • NYA_NYA150R_3-5-13.png
    NYA_NYA150R_3-5-13.png
    31.3 KB · Views: 250
  • NYA_BPNYA_3-5-13.png
    NYA_BPNYA_3-5-13.png
    30.2 KB · Views: 281
Attached is the NYSE long, medium and short term moving average breadth charts and the NYSE Bullish Percent Index.

The medium and longer term Bear Alerts from my last update two weeks ago have been averted with reversals on the NYSE Percentage of Stocks above their 200 day Moving Averages and the NYSE Percentage of Stocks above their 150 day Moving Averages charts to a column of Xs and hence they regain Bull Confirmed status once more near the upper end of their ranges. Also, you'll note that the time period above the key 70% level has now been over 4 months, which as you can see on the line chart is not out of the ordinary, as the 2010 move above 70% lasted for around 7 months until it broke down in May 2011. And so there's certainly recent precedent for it to continue for longer, but be aware that we are in the upper end of the scale and that we are moving towards right side of the bell curve.

The short term NYSE Percentage of Stocks above their 50 day Moving Averages chart has also regained the 70% level, with a new continuation breakout on Friday and is also now back on Bull Confirmed status with a little bit of potential upside capacity after being refreshed down to the 42% level. So that means that a lot of stocks have had a pullback below their 50 day moving averages and have now recovered back above it.

To view the US Industry Sectors Breadth charts go to the stageanalysis forum.

attachment.php
 

Attachments

  • $BPNYA_3-5-13.png
    $BPNYA_3-5-13.png
    17.8 KB · Views: 205
  • NYA200R_3-5-13.png
    NYA200R_3-5-13.png
    18.5 KB · Views: 214
  • NYA150R_3-5-13.png
    NYA150R_3-5-13.png
    17.8 KB · Views: 218
  • NYA50R_3-5-13.png
    NYA50R_3-5-13.png
    16.9 KB · Views: 170
  • market-breadth-table_3-5-13.png
    market-breadth-table_3-5-13.png
    22.8 KB · Views: 704
  • NYA200R_line_3-5-13.png
    NYA200R_line_3-5-13.png
    36 KB · Views: 172
  • NYA150R_line_3-5-13.png
    NYA150R_line_3-5-13.png
    37.7 KB · Views: 187
  • NYA50R_line_3-5-13.png
    NYA50R_line_3-5-13.png
    35 KB · Views: 199
Top