Best Thread Market Breadth

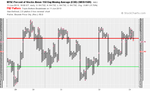
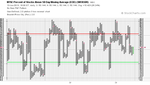
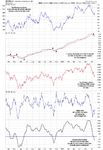
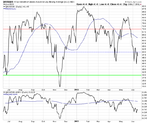
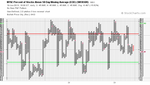
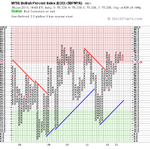
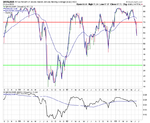
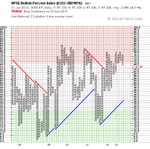
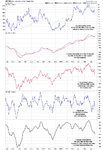
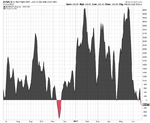
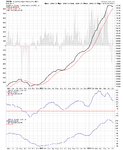
NYSE Percentage of Stocks above their 150 day Moving Averages $NYA150R

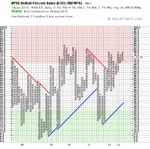
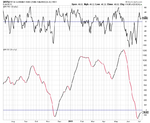
The medium term NYSE Percentage of Stocks above their 150 day Moving Averages chart ($NYA150R) broke down yesterday with a triple bottom sell signal on the P&F chart, and so is now on Bear Confirmed status.

attachment.php


attachment.php
 

Attachments

  • NYA150R_11-6-13.png
    NYA150R_11-6-13.png
    18.9 KB · Views: 662
  • NYA150R_line_11-6-13.png
    NYA150R_line_11-6-13.png
    36.9 KB · Views: 704
NYSE Percentage of Stocks above their 50 day MA - status change

The short term NYSE Percentage of Stocks above their 50 day Moving Averages chart ($NYA50R) made a continuation move lower today with a breakdown below 40%, moving it back to Bear Confirmed status. So currently only 39.72% of stocks in the NYSE are above their 50 day moving average, and so now the short, medium and long term moving average breadth charts are all bearish, and so we need to consider if the US market is moving into Stage 3. Attached are the charts.

attachment.php


attachment.php
 

Attachments

  • NYA50R_12-6-13.png
    NYA50R_12-6-13.png
    16.9 KB · Views: 639
  • NYA50R_line_12-6-13.png
    NYA50R_line_12-6-13.png
    36.8 KB · Views: 659
NYSE Percentage of Stocks above their 50 day MA - status change

The short term NYSE Percentage of Stocks above their 50 day Moving Averages chart ($NYA50R) made yet another reversal yesterday, highlighting the increased volatility currently. And so moves back to a column of Os and Bear Correction Status

attachment.php
 

Attachments

  • NYA50R_13-6-13.png
    NYA50R_13-6-13.png
    16.3 KB · Views: 650
Advance Decline Breadth Charts

Attached is the updated Advance Decline Breadth Charts, including the cumulative AD line, momentum index, cumulative AD volume line, 10 Day AD oscillator and the McClellan Oscillator and Summation Index.

Notes:
  • Cumulative Advance Decline Line - closed the week below it's 50 day MA
  • Advance Decline Momentum Index - near the April swing low
  • Cumulative Advance Decline Line 10 and 30 day moving averages - had a negative crossover this week to give a medium term sell signal
  • Cumulative Advance Decline Line - the detrended distance above the 200 day EMA chart shows the November to May uptrend is over and it is now in a short term downtrend
  • Advance Decline 10 Day Oscillator - rebounded off of it's extreme reading of over -800 last week and formed a short term higher low
  • Advance Decline MACD line - continues to move lower below it's zero line and so is currently on a sell signal
  • McClellan Oscillator - is making similar moves to the Advance Decline 10 Day Oscillator
  • McClellan Summation Index - has continued to move lower towards it's zero line.
 

Attachments

  • NYSI_D_14-6-13.png
    NYSI_D_14-6-13.png
    32.1 KB · Views: 257
  • NYUD_Alt_14-6-13.png
    NYUD_Alt_14-6-13.png
    64.2 KB · Views: 234
  • NYUD_NYTV_Cum_14-6-13.png
    NYUD_NYTV_Cum_14-6-13.png
    41.8 KB · Views: 259
  • NYAD_Alt_14-6-13.png
    NYAD_Alt_14-6-13.png
    62.2 KB · Views: 249
  • NYAD_NYTV_Cum_14-6-13.png
    NYAD_NYTV_Cum_14-6-13.png
    34.6 KB · Views: 202
New Highs New Lows $NYHL

Attached is the New Highs / New Lows charts
 

Attachments

  • NYHL_D_14-6-13.png
    NYHL_D_14-6-13.png
    46.3 KB · Views: 240
  • USHL5_W_14-6-13.png
    USHL5_W_14-6-13.png
    32.1 KB · Views: 231
  • NYHL_Cum_14-6-13.png
    NYHL_Cum_14-6-13.png
    39.3 KB · Views: 229
Attached is the NYSE long, medium and short term moving average breadth charts and the NYSE Bullish Percent Index which shows the current state of the market. The long and medium term charts are on Bear Confirmed status, whereas the short term charts reversed back to Xs in the middle of the range on Thursday, and so are on Bear Correction status currently.

attachment.php
 

Attachments

  • NYA200R_line_14-6-13.png
    NYA200R_line_14-6-13.png
    35.2 KB · Views: 243
  • NYA50R_14-6-13.png
    NYA50R_14-6-13.png
    16.3 KB · Views: 256
  • NYA150R_14-6-13.png
    NYA150R_14-6-13.png
    18.1 KB · Views: 250
  • NYA200R_14-6-13.png
    NYA200R_14-6-13.png
    19.4 KB · Views: 247
  • $BPNYA_14-6-13.png
    $BPNYA_14-6-13.png
    18 KB · Views: 261
  • market-breadth-table_14-6-13.png
    market-breadth-table_14-6-13.png
    22.3 KB · Views: 659
  • NYA50R_line_14-6-13.png
    NYA50R_line_14-6-13.png
    36.6 KB · Views: 257
  • NYA150R_line_14-6-13.png
    NYA150R_line_14-6-13.png
    36.9 KB · Views: 262
NYSE Percentage of Stocks above their 50 day MA - status change

The short term NYSE Percentage of Stocks above their 50 day Moving Averages chart ($NYA50R) made another status change today as it made a double top breakout and so moved back to Bull Confirmed status in the short term.

attachment.php


attachment.php
 

Attachments

  • NYA50R_18-6-13.png
    NYA50R_18-6-13.png
    17 KB · Views: 611
  • NYA50R_line_18-6-13.png
    NYA50R_line_18-6-13.png
    36.5 KB · Views: 618
NYSE Percentage of Stocks above their 50 day MA - status change

The volatility continues with yet another short term status change. Yesterdays breakout failed, and it's back to a column of Os again for the NYSE Percentage of Stocks above their 50 day Moving Averages chart ($NYA50R) - so Bull Correction status now with a move below 38% required to go back to Bear Confirmed again.

attachment.php
 

Attachments

  • NYA50R_19-6-13.png
    NYA50R_19-6-13.png
    16.8 KB · Views: 611
NYSE Bullish Percent Index $BPNYA - reversal to defense

The NYSE Bullish Percent Index has today reversed and is now in a column of Os at the critical 70% level, and so moves to Bull Correction status, but is very close to a potential double bottom sell signal if it closes below 68%.

attachment.php


The medium term NYSE Percentage of Stocks above their 150 day Moving Averages chart ($NYA150R) chart moved lower and closed below it's 60% level, which is important, as a phenomenon know as the 80-60-40 rule now comes into play - where historical statistics show that there's now a high probability of it reaching 40% before it next reaches 80%.

attachment.php


The short term NYSE Percentage of Stocks above their 50 day Moving Averages chart ($NYA50R) gave another double bottom breakdown and so moves once again back to Bear Confirmed status. But note that it's now moving into the lower range of the chart.

attachment.php
 

Attachments

  • $BPNYA_20-6-13.png
    $BPNYA_20-6-13.png
    18 KB · Views: 787
  • NYA150R_20-6-13.png
    NYA150R_20-6-13.png
    18.9 KB · Views: 768
  • NYA50R_20-6-13.png
    NYA50R_20-6-13.png
    20.5 KB · Views: 752
Re: Market Breadth Update

Attached is the NYSE Bullish Percent Index and the NYSE long, medium and short term moving average breadth charts, which have now all moved into negative territory.

attachment.php


Today saw the first double bottom breakdown on the NYSE Bullish Percent Index since August 2011 and moves the long term gauge to Bear Confirmed status while crossing below the key 70% level.

attachment.php
 

Attachments

  • NYA200R_line_21-6-13.png
    NYA200R_line_21-6-13.png
    34.8 KB · Views: 246
  • NYA50R_21-6-13.png
    NYA50R_21-6-13.png
    16.9 KB · Views: 244
  • NYA150R_21-6-13.png
    NYA150R_21-6-13.png
    18.8 KB · Views: 262
  • NYA200R_21-6-13.png
    NYA200R_21-6-13.png
    19.6 KB · Views: 279
  • $BPNYA_21-6-13.png
    $BPNYA_21-6-13.png
    18.2 KB · Views: 780
  • NYA150R_line_21-6-13.png
    NYA150R_line_21-6-13.png
    36.6 KB · Views: 253
  • NYA50R_line_21-6-13.png
    NYA50R_line_21-6-13.png
    36.4 KB · Views: 266
  • market-breadth-table_21-6-13.png
    market-breadth-table_21-6-13.png
    22 KB · Views: 736
Advance Decline Breadth Charts

Attached is the updated Advance Decline Breadth Charts, including the cumulative AD line, momentum index, cumulative AD volume line, 10 Day AD oscillator and the McClellan Oscillator and Summation Index.
 

Attachments

  • NYSI_D_21-6-13.png
    NYSI_D_21-6-13.png
    32.6 KB · Views: 266
  • NYUD_Alt_21-6-13.png
    NYUD_Alt_21-6-13.png
    63.6 KB · Views: 244
  • NYUD_NYTV_Cum_21-6-13.png
    NYUD_NYTV_Cum_21-6-13.png
    41.9 KB · Views: 262
  • NYAD_Alt_21-6-13.png
    NYAD_Alt_21-6-13.png
    62.5 KB · Views: 270
  • NYAD_NYTV_Cum_21-6-13.png
    NYAD_NYTV_Cum_21-6-13.png
    34.8 KB · Views: 283
New Highs New Lows $NYHL

Attached is the New Highs / New Lows charts
 

Attachments

  • NYHL_D_21-6-13.png
    NYHL_D_21-6-13.png
    47.1 KB · Views: 274
  • USHL5_W_21-6-13.png
    USHL5_W_21-6-13.png
    32.5 KB · Views: 250
  • NYHL_Cum_21-6-13.png
    NYHL_Cum_21-6-13.png
    39.1 KB · Views: 273
Attached is the NYSE Bullish Percent Index and the NYSE long, medium and short term moving average breadth charts.

The rest of the updated custom breadth charts are on the other market breadth thread as usual.

attachment.php


The NYSE Bullish Percent Index

$BPNYA_5-7-13.png

NYSE Percentage of Stocks above their 200 Day, 150 Day and 50 Day Moving Averages P&F charts

NYA200R_5-7-13.pngNYA150R_5-7-13.pngNYA50R_5-7-13.png

NYSE Percentage of Stocks above their 200 Day, 150 Day and 50 Day Moving Averages line charts

NYA200R_line_5-7-13.pngNYA150R_line_5-7-13.pngNYA50R_line_5-7-13.png
 

Attachments

  • market-breadth-table_5-7-13.png
    market-breadth-table_5-7-13.png
    23.2 KB · Views: 768
Last edited:
Advance Decline Breadth Charts

Attached is the updated Advance Decline Breadth Charts, including the cumulative AD line, momentum index, cumulative AD volume line, 10 Day AD oscillator, the McClellan Oscillator and Summation Index, and finally the SPX:put/Call ratio chart.

Note the interesting divergence in the SPX divided by the Put/Call ratio chart between what the professionals are doing and the retail traders are doing.
 

Attachments

  • NYAD_NYTV_Cum_5-7-13.png
    NYAD_NYTV_Cum_5-7-13.png
    34.7 KB · Views: 233
  • NYAD_Alt_5-7-13.png
    NYAD_Alt_5-7-13.png
    62.8 KB · Views: 256
  • NYUD_NYTV_Cum_5-7-13.png
    NYUD_NYTV_Cum_5-7-13.png
    41.5 KB · Views: 245
  • NYUD_Alt_5-7-13.png
    NYUD_Alt_5-7-13.png
    62 KB · Views: 266
  • NYSI_D_5-7-13.png
    NYSI_D_5-7-13.png
    34.4 KB · Views: 281
  • SPX_CPC_5-7-13.png
    SPX_CPC_5-7-13.png
    36.8 KB · Views: 260
New Highs New Lows $NYHL

Attached is the New Highs / New Lows charts.
 

Attachments

  • NYHL_Cum_5-7-13.png
    NYHL_Cum_5-7-13.png
    39.4 KB · Views: 273
  • USHL5_W_5-7-13.png
    USHL5_W_5-7-13.png
    31.5 KB · Views: 276
  • NYHL_D_5-7-13.png
    NYHL_D_5-7-13.png
    48.2 KB · Views: 246
Market Breadth Charts Update

Attached is the NYSE Bullish Percent Index and the NYSE long, medium and short term moving average breadth charts, the advance decline line and the new high new lows.

attachment.php


The NYSE Bullish Percent Index

$BPNYA_16-8-13.png

NYSE Percentage of Stocks above their 200 Day, 150 Day and 50 Day Moving Averages P&F charts

NYA200R_16-8-13.pngNYA150R_16-8-13.pngNYA50R_16-8-13.png

Advance Decline Line

NYAD_Cum_16-8-13.png

New Highs New Lows

NYHL_D_16-8-13.png
 

Attachments

  • market-breadth-table_16-8-13.png
    market-breadth-table_16-8-13.png
    24.2 KB · Views: 867
NYSE Market Breadth Update

The NYSE Bullish Percent Index

$BPNYA_15-8-14.png$BPNYA_line_15-8-14.png

NYSE Percentage of Stocks above their 200 Day, 150 Day and 50 Day Moving Averages P&F charts

NYA200R_15-8-14.pngNYA150R_15-8-14.pngNYA50R_15-8-14.png

NYSE Percentage of Stocks above their 200 Day, 150 Day and 50 Day Moving Averages line charts

NYA200R_line_15-8-14.pngNYA150R_line_15-8-14.pngNYA50R_line_15-8-14.png

NYSE Advance Decline Line

NYAD_Cum_15-8-14.png

NYSE New Highs New Lows

NYHL_D_15-8-14.pngNYHL_Cum_15-8-14.png
 
Top