isatrader
Senior member
- Messages
- 2,965
- Likes
- 136
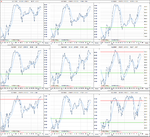
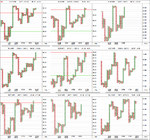
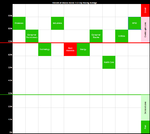
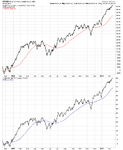
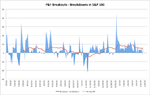
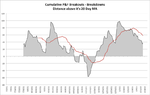
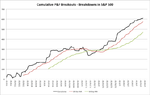
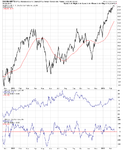
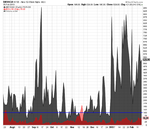
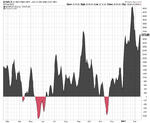
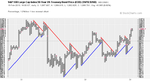
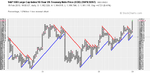
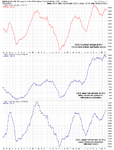
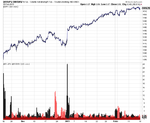
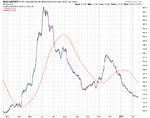
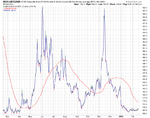
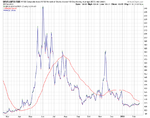
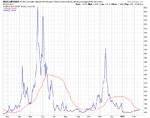
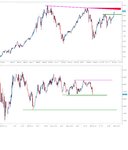
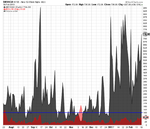
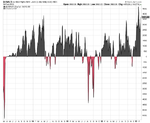
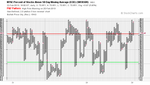
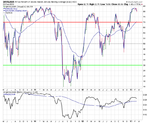
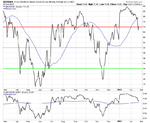
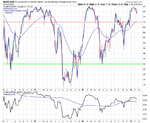
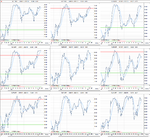
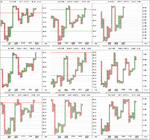
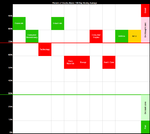
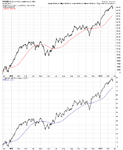
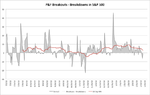
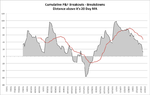
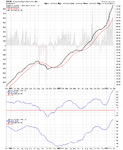
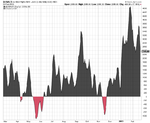
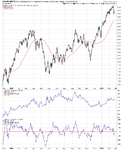
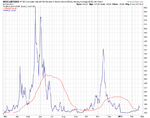
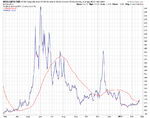
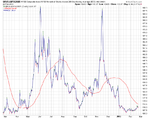
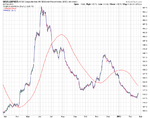
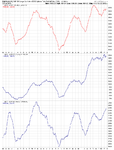
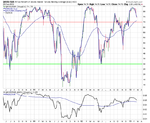
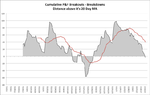
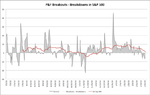
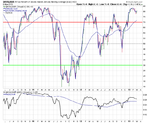
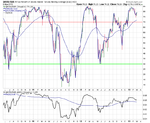
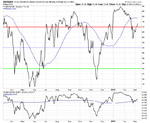
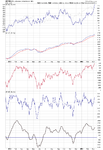
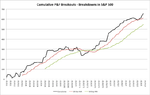
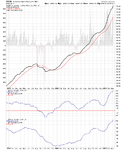
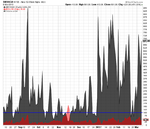
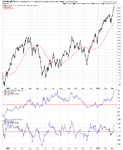
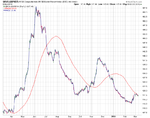
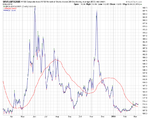
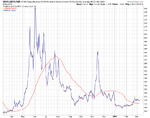
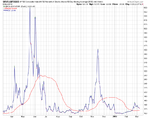
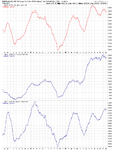
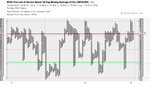
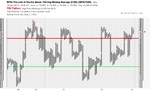
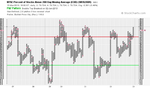
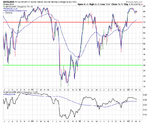
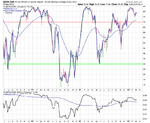
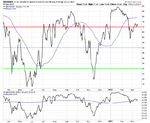
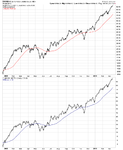
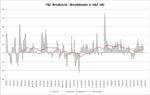
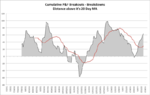
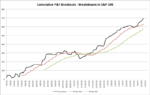
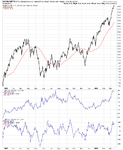
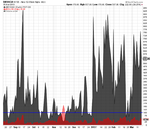
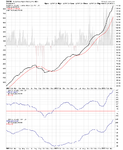
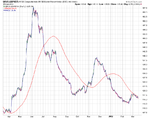
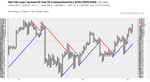
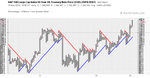
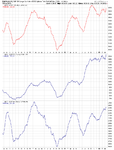
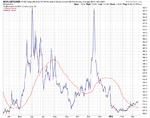
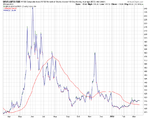
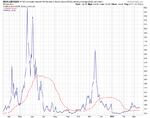
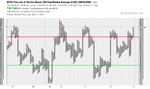
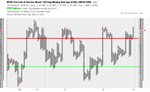
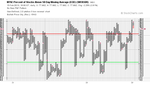
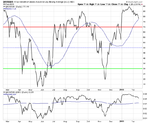
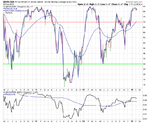
Attached is the long, medium and short term moving average breadth charts and the NYSE Bullish Percent Index. Since my last update two weeks ago the short term moving average breadth charts have all moved onto Bull Correction status after reaching the extreme top 10% of their ranges. This has now eased a bit with the average for the four now in the mid 80% range - which is still very high, but is not quite so one sided.
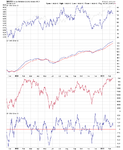
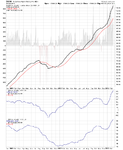
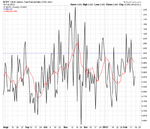
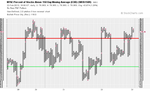
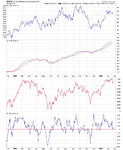
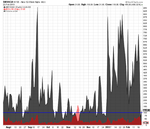
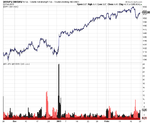
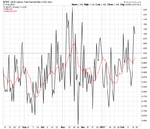
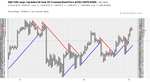
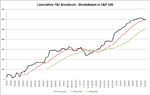
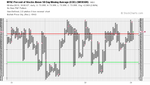
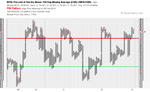
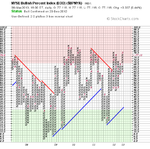
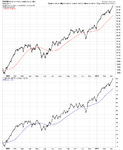
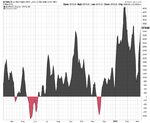
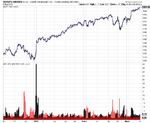
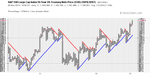
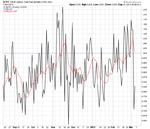
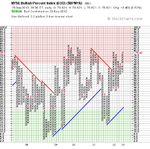
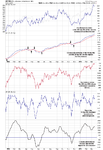
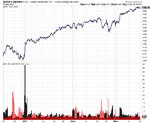
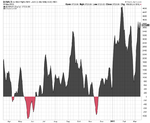
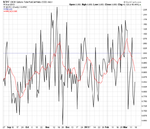
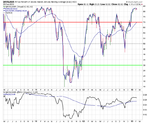
The NYSE Bullish Percent Index continues to push higher and currently 78.85% of stocks in the NYSE are on P&F buy signals. Dorsey did an article back in January 2012 that looked back over the history of the Bullish Percent Index and how long it stayed above the 70% level once it reached that point. The average time was 96 days over the last 25 years, and so as the index moved above 70% on 3rd Jan 2013, the average time would take it until mid April. But every time is different, and so we need to stay alert and prepare for when it next moves to defense as the risk continues to grow.


The NYSE Bullish Percent Index continues to push higher and currently 78.85% of stocks in the NYSE are on P&F buy signals. Dorsey did an article back in January 2012 that looked back over the history of the Bullish Percent Index and how long it stayed above the 70% level once it reached that point. The average time was 96 days over the last 25 years, and so as the index moved above 70% on 3rd Jan 2013, the average time would take it until mid April. But every time is different, and so we need to stay alert and prepare for when it next moves to defense as the risk continues to grow.
Attachments
-
 $BPNYA_15-2-13.png18.2 KB · Views: 250
 -
 NYA200R_15-2-13.png19.1 KB · Views: 230
 -
 NYA150R_15-2-13.png18.5 KB · Views: 238
 -
 NYA50R_15-2-13.png16.5 KB · Views: 296
 -
 NYA200R_line_15-2-13.png38.5 KB · Views: 302
 -
 ST_MA-breadth-table_15-2-13.png12.7 KB · Views: 793
 -
 market-breadth-table_15-2-13.png11.9 KB · Views: 803
 -
 NYA50R_line_15-2-13.png35.8 KB · Views: 285
 -
 NYA150R_line_15-2-13.png41.2 KB · Views: 296