You are using an out of date browser. It may not display this or other websites correctly.
You should upgrade or use an alternative browser.
You should upgrade or use an alternative browser.
isatrader
Senior member
- Messages
- 2,965
- Likes
- 136
Thanks isatrader.
I'll have a look at it.
My system produces P&F charts easily, and I try them periodically but I can't seem to see the patterns as well as I can with ordinary candles.
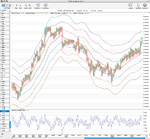
Well I think the keltner channels give it some more perspective. I've set them at 3 x average true range and made a longer term chart. I think it shows that we're at a key resistance, but if it breaks through then 8200 is the next level.
Attachments
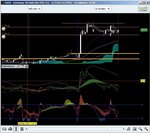
Here's an example of one of my charts. I basically use support and resistance determined by me and highlighted on the chart at the end of each day for the next day. For the S&R I use historic levels (daily, weekly, intraday) as well as Fib levels.
I also have some EMA's (50,100,200) and middle Bollinger. Plus, I have a couple of custom indicators to guage trend strength and direction as well as one component from Ichimoku charting (the cloud).
I also periodically try to trim the use of indicators as I can overindulge!!😱
I also have some EMA's (50,100,200) and middle Bollinger. Plus, I have a couple of custom indicators to guage trend strength and direction as well as one component from Ichimoku charting (the cloud).
I also periodically try to trim the use of indicators as I can overindulge!!😱
Attachments
Last edited:
Stopped out of DAX short @ 7278.
Back in at 7280, £3/pt. Stop @ 7290, target, 7215.
10 out of 10 for persistence! 🙂
isatrader
Senior member
- Messages
- 2,965
- Likes
- 136
Trading Update
BG Group had good results today and is moving along nicely, currently +3.28%, and the squeeze play in Talvivaara Mining popped up today with a nice move to the 2ATR level on increasing volume and closed just below it. So that's currently at +1.86%.
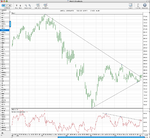
Barclays (BARC.L) has caught my eye from the group thread I'm doing and I might put a trade on that this week or next if it stays above the downtrend line on the weekly chart. Attached is the charts. Also Lloyds Banking Group (LLOY.L) is a possible value play for a long term buy I think as the sellers are looking like they're getting to the exhaustion point as the last two lows were very week on force index volume. So I'm going to do a bit of research into that as well.
BG Group had good results today and is moving along nicely, currently +3.28%, and the squeeze play in Talvivaara Mining popped up today with a nice move to the 2ATR level on increasing volume and closed just below it. So that's currently at +1.86%.
Barclays (BARC.L) has caught my eye from the group thread I'm doing and I might put a trade on that this week or next if it stays above the downtrend line on the weekly chart. Attached is the charts. Also Lloyds Banking Group (LLOY.L) is a possible value play for a long term buy I think as the sellers are looking like they're getting to the exhaustion point as the last two lows were very week on force index volume. So I'm going to do a bit of research into that as well.
Attachments
isatrader
Senior member
- Messages
- 2,965
- Likes
- 136
DAX short: Stop to 7330 (+9 pts).
Hi SlipperyC, quick question. Does the US open normally have a big effect on the DAX or is it less correlated than say the FTSE 100?
Can have quite a dramatic effect. The DAX is spiky anyway and a decisive move by the US indices can throw it around.
However, generally when the day isn't so active, it will just blend in quite smoothly with the US open. As if it was programmed to?!?!!
However, generally when the day isn't so active, it will just blend in quite smoothly with the US open. As if it was programmed to?!?!!
isatrader
Senior member
- Messages
- 2,965
- Likes
- 136
Talvivaara Mining Rolling Spread
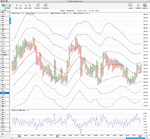
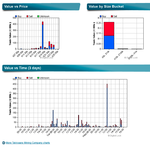
TALV.L is moving along nicely again today. There was 3 big volume orders at around midday today at the 618 level which was vastly bigger than recent volume levels, so I think this one will have the strength to at least test the previous high and a possible breakout with any luck. It will be interesting to see the earnings next Wednesday as this could turn into a longer term holding for me if they are good.
TALV.L is moving along nicely again today. There was 3 big volume orders at around midday today at the 618 level which was vastly bigger than recent volume levels, so I think this one will have the strength to at least test the previous high and a possible breakout with any luck. It will be interesting to see the earnings next Wednesday as this could turn into a longer term holding for me if they are good.
Attachments
DAX short: Stopped out at 7330 for +9
Re-short, £5/pt, 7335. Stop: 7353. Target: 7301 initially, may aim for 7220.
Reason: Meeting more resistance in this area.
I wouldn't be surprised to see the DAX hit 7400 in the next few days, with the current trend.
Maybe Leonardo, maybe. The indy's seem in total blowout mode at the moment. It can only end in tears, thats why I'm keeping the stops tight.
One 'canary' for me is the Aussie Dollar (AUD/USD) which is a good indicator of risk. Its been diverging with the DAX (and others) over the last couple of days.
Well done isatrader. Are you using a software filter to select the stocks you've chosen?
One 'canary' for me is the Aussie Dollar (AUD/USD) which is a good indicator of risk. Its been diverging with the DAX (and others) over the last couple of days.
Well done isatrader. Are you using a software filter to select the stocks you've chosen?
Last edited:
isatrader
Senior member
- Messages
- 2,965
- Likes
- 136
Maybe Leonardo, maybe. The indy's seem in total blowout mode at the moment. It can only end in tears, thats why I'm keeping the stops tight.
Well done isatrader. Are you using a software filter to select the stocks you've chosen?
No, I'm looking for them manually at the moment, but limiting myself to the FTSE 350, so it doesn't take forever. My main interest at the moment is stocks that have made a recent breakout on the weekly chart and then looking at daily timeframe on the ones that look interesting to see if any have divergences with the indicators I use.
DAX short; out for +5.
A better target would have been the low of day (around 7315), which provided good support, then a long trade from that area.
Still convinced it is heading down today/tomorrow so will trade what I see and wait for another good entry.
A better target would have been the low of day (around 7315), which provided good support, then a long trade from that area.
Still convinced it is heading down today/tomorrow so will trade what I see and wait for another good entry.
isatrader
Senior member
- Messages
- 2,965
- Likes
- 136
Stock Watchlist
I'm experimenting with a few strategies for finding good short term stop picks. The following stocks from the FTSE 350 look promising at the moment to me, so I'll add them to my short term watchlist. They are:
Centrica (CNA.L)
GKN (GKN.L)
Severn Trent (SVT.L)
Whitbread (WTB.L)
I'm experimenting with a few strategies for finding good short term stop picks. The following stocks from the FTSE 350 look promising at the moment to me, so I'll add them to my short term watchlist. They are:
Centrica (CNA.L)
GKN (GKN.L)
Severn Trent (SVT.L)
Whitbread (WTB.L)