You are using an out of date browser. It may not display this or other websites correctly.
You should upgrade or use an alternative browser.
You should upgrade or use an alternative browser.
isatrader
Senior member
- Messages
- 2,965
- Likes
- 136
Short Hecla Mining (HL) 918.5, stop 942
I adjusted my stop to 950 to allow for 4 point spread and possible fake breakout as thought my initial stop was a little too tight. But price action seems to be bullish and have been stopped out at 950
Account Loss: -0.26%
isatrader
Senior member
- Messages
- 2,965
- Likes
- 136
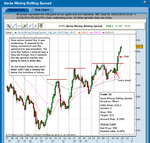
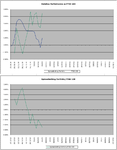
Hecla Mining Trade
I had a bit of a slip in discipline again today as I entered the trade in Hecla Mining without doing a thorough plan first and didn't wait for a closing bar below the trendline before entering the trade.
Price action looked like it was weakening. It seemed to be losing momentum and the uptrend line was breached. The price bar before I entered had a long tail though, but it seemed like the general market was going to have a down day. So my mistake was predicting what would happen instead of trading what actually was happening.
Attachments
isatrader
Senior member
- Messages
- 2,965
- Likes
- 136
Committed one of the cardinal sins just now, moved my stop on the DAX short to 7220 as the DAX was getting close.
I really don't think its going to reach that level!!! Might add to the short at this level if it weakens off.
Is an easy one to make. I did it earlier and regretted it. I think every time I move my stop to "give it more room" I end up regretting it.
isatrader
Senior member
- Messages
- 2,965
- Likes
- 136
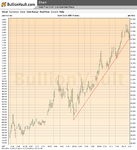
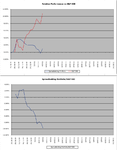
Gold Pivot?
Gold has caught my eye again today. It has broken out of it's recent downtrend, after bouncing on the 2 year trend line this week. I think if it can close the week strongly tomorrow then I will look to play it again next week.
Gold has caught my eye again today. It has broken out of it's recent downtrend, after bouncing on the 2 year trend line this week. I think if it can close the week strongly tomorrow then I will look to play it again next week.
Attachments
Couldn't post earlier, site down. Stopped out on my DAX short at 7220. Waiting to see what happens in this area, may short again.
not chasing a top against a strong uptrend by any chance...?
isatrader
Senior member
- Messages
- 2,965
- Likes
- 136
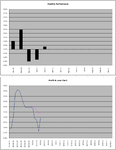
Account Update
I had a better week this week with a successful trade in Fresnillo and BG Group recovered and made a weekly closing high, so I'm looking to hold that one for a while as I believe it's at the beginning of a weekly breakout which could take months to play out. I attempted a short in Hecla Mining later in the week, however, Silver made a strong move to the upside and I was stopped out.
This weeks mistake for my list was that I moved my stop to give the trade a little bit more room and was promptly stopped out anyway. This is frequently the case when I do this, so my aim is to outlaw this practice in my trading.
The S&P 500 continues to outperform my account and has done 9.82% better since I began in October, so my aim is to recover this outperform in the future.
Performance
My SB Account
Weekly: 1.33%
YTD: -0.95%
S&P 500
Weekly: 2.71%
YTD: +4.23%
FTSE 100
Weekly: 1.97%
YTD: 1.65%
Attachments
isatrader
Senior member
- Messages
- 2,965
- Likes
- 136
isatrader
Senior member
- Messages
- 2,965
- Likes
- 136
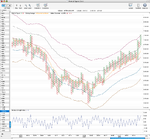
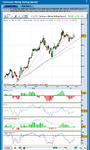
DAX Point and figure chart
I managed to work out how to get my end of day charting software to do point and figure charts and managed to get the Keltner channels on it as well, so I though you might a appreciate a different view of the DAX SlipperyC. See attached.
I managed to work out how to get my end of day charting software to do point and figure charts and managed to get the Keltner channels on it as well, so I though you might a appreciate a different view of the DAX SlipperyC. See attached.