You are using an out of date browser. It may not display this or other websites correctly.
You should upgrade or use an alternative browser.
You should upgrade or use an alternative browser.
isatrader
Senior member
- Messages
- 2,965
- Likes
- 136
Oh, great trade on Fres, isatrader! :clap:
Thanks, good luck with the DAX short.
isatrader
Senior member
- Messages
- 2,965
- Likes
- 136
isatrader
Senior member
- Messages
- 2,965
- Likes
- 136
Market Breadth Charts
It's been a while since I looked at the market breadth charts and thought with the key levels on the indicies being broken today that it would be good to have another look under the surface and and see how strong the foundations of this market are.
So attached is the the following Market Breadth Charts from stockcharts.com free charts section:
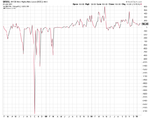
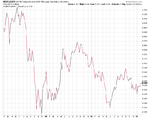
$CPC (CBOE Options Total Put/Call Ratio)
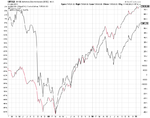
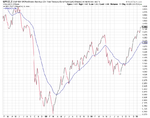
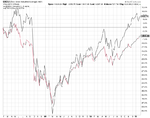
$NYAD (NYSE Advance Decline Issues (EOC)) – I’ve put the S&P 500 behind to compare.
$NYSI (NYSE McClellan Chart)
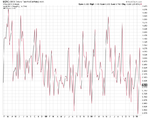
$NYHL (NYSE New Highs-New Lows (EOD))
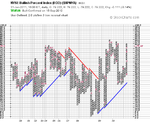
$BPNYA (NYSE Bullish Percent Index)
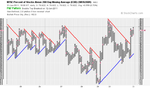
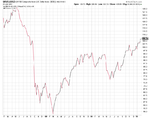
$NYA200R (NYSE Percent of stocks above the 200 day moving average)
Also I’ve included the following relative performance charts
$NYA:$USD (NYSE/US Dollar)
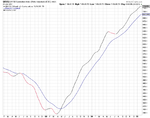
$NYA:$SPX (NYSE/S&P 500)
$INDU ($TRAN behind price – Dow Theory)
SPY:TLT (S&P 500 SPDRs/iShares Barclays 20+ Year Treasury Bond Fund – This is a measure of the risk on, risk off trade.)
It's been a while since I looked at the market breadth charts and thought with the key levels on the indicies being broken today that it would be good to have another look under the surface and and see how strong the foundations of this market are.
So attached is the the following Market Breadth Charts from stockcharts.com free charts section:
$CPC (CBOE Options Total Put/Call Ratio)
$NYAD (NYSE Advance Decline Issues (EOC)) – I’ve put the S&P 500 behind to compare.
$NYSI (NYSE McClellan Chart)
$NYHL (NYSE New Highs-New Lows (EOD))
$BPNYA (NYSE Bullish Percent Index)
$NYA200R (NYSE Percent of stocks above the 200 day moving average)
Also I’ve included the following relative performance charts
$NYA:$USD (NYSE/US Dollar)
$NYA:$SPX (NYSE/S&P 500)
$INDU ($TRAN behind price – Dow Theory)
SPY:TLT (S&P 500 SPDRs/iShares Barclays 20+ Year Treasury Bond Fund – This is a measure of the risk on, risk off trade.)
Attachments
-
 sc-2.png45.4 KB · Views: 182
 -
 sc-3.png30.8 KB · Views: 194
 -
 sc-4.png19.6 KB · Views: 213
 -
 sc-5.png22.4 KB · Views: 165
 -
 SharpChartv05-2.png35 KB · Views: 184
 -
 SharpChartv05-3.png43.9 KB · Views: 172
 -
 sc-9.png31.9 KB · Views: 169
 -
 sc-8.png34.5 KB · Views: 173
 -
 sc-7.png29 KB · Views: 168
 -
 sc-6.png23.3 KB · Views: 167
isatrader
Senior member
- Messages
- 2,965
- Likes
- 136
Watchlist Addition
Talvivaara Mining (TALV) - Nickel and Zinc miner. Made a weekly breakout a few months back and consolidated during January. Divergence in the force index with the price action, so I will look for a possible entry tomorrow in this if the price action looks positive.
Talvivaara Mining (TALV) - Nickel and Zinc miner. Made a weekly breakout a few months back and consolidated during January. Divergence in the force index with the price action, so I will look for a possible entry tomorrow in this if the price action looks positive.
Attachments
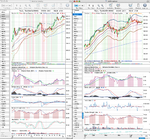
Thanks for the charts isatrader. In my opinion they show divergences between current price action and what it 'should' be.
Took a bath on my DAX short (-50 pts, £250!). Hindsight: Should have WAITED for the H&S pattern to confirm first! Didn't expect the price action to be so robust through the 7140-50 area. A clue lay in the Aussie dollar which was consolidating around parity most of the time, waiting to pop-up.
DAX has broken to multiweek/month highs now and could have a clear run to 7300-7500. UNLESS its a fake breakout!
Note to self; As always, trade what you see not what you think and BE PATIENT.
isatrader
Senior member
- Messages
- 2,965
- Likes
- 136
Thanks for the charts isatrader. In my opinion they show divergences between current price action and what it 'should' be.
Took a bath on my DAX short (-50 pts, £250!). Hindsight: Should have WAITED for the H&S pattern to confirm first! Didn't expect the price action to be so robust through the 7140-50 area. A clue lay in the Aussie dollar which was consolidating around parity most of the time, waiting to pop-up.
DAX has broken to multiweek/month highs now and could have a clear run to 7300-7500. UNLESS its a fake breakout!
Note to self; As always, trade what you see not what you think and BE PATIENT.
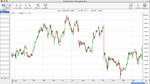
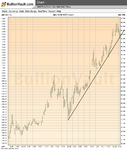
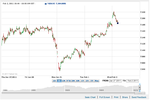
Sorry your short didn't work out. I always find it hard going short personally. It's great when your timing is right as the moves are fast and violent but I'm normally too early. One thing I noticed with your short was that the DAX had gaped higher on the open and was back filling the gap. I'm not sure if you could see it on your chart as I presume your chart has the overnight action as well? You should post a marked up chart of where you entered and exited as it will be interesting? Here's the chart from yahoo which shows the days action only, do you see the gap yesterday? It looks like it could be doing the same today?
Attachments
isatrader
Senior member
- Messages
- 2,965
- Likes
- 136
Yes, I saw the gap. I filter out overnight action for that reason. I was actually long from 7115 but had a target of 7145 and the short waiting at 7140.
I'll see if I can post a chart for the next one.
That would be good, thanks.
I was thinking some more about Average True Range last night after reading a Van Tharp article, so I had a look at the indicies ranges each day, and each week. So in the case of the DAX the 52 week average true range is 228.47 points and the 200 day average true range is 101.20 points. So I'm going to try and see if there's a way to apply this in my trading as think for example if the price has already moved 100 points in a day then the probability of a reversal should be higher if that's it's normal range?
Interesting theory. I've tried - over the years - to apply lots of different strategies to trading the DAX.
Ultimately, nothing worked except awareness of its unique patterns through experience and the realisation that its a spiky bugger - both long and short - and will try its hardest to throw traders off!
Anyway, I think its showing weakness today, so I'm short from now (10.18am).
Short DAX, £3/pt, 7191. Stop 7210. Target, 7130.