isatrader
Senior member
- Messages
- 2,965
- Likes
- 136
Re: Support and Resistance
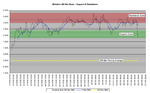
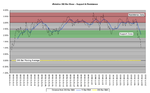
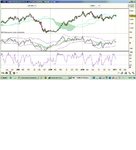
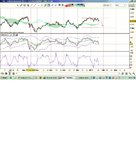
Price action is now approaching the 2% support area above the SMA. So a possible pause and rebound soon. It will be interesting to see if it can break through 2% level today as it will make me much more bearish.
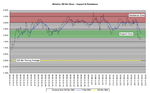
Price is currently at 3.43% above the 200 bar SMA and so a short term top is likely soon maybe?
Price action is now approaching the 2% support area above the SMA. So a possible pause and rebound soon. It will be interesting to see if it can break through 2% level today as it will make me much more bearish.