isa's short term trading journal

Hecla Mining (HL) – Stopped Out

Trade
Hecla Mining Mar 11 Spread

Entry Price: 1036.5

Stop: 968
Target: 1161.5

Account Risk: 0.55%
Potential Account Profit: 1.01%
Risk Ratio: 1.82

Hecla Mining (HL) is a silver miner and has a big run of late. Looks like it’s pivoting to me and following the gold and silver move. My entry wasn’t as good as I wanted as I just missed my target price, so the risk is 0.05% higher than my maximum for a single trade of 0.50%

Closing trade

Entry: 11/1/11
Price: 1036.5

Exit: 14/1/11
Price: 950.4

Points: -86.1
Trade Percentage: -8.31%

Daily Channel Captured: -34%
Trade Grade: F

Account P/L: -0.69%

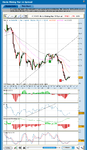
Hecla Mining (HL) was stopped out at the open on Friday. Moving the stop loss turned out to be a big mistake as the stock gaped down below it and was filled at a much worse price. I ignored a number of signals that the stock was turning lower because I thought the previous low would hold. The stock had a sharp sell off of over 6% in one day following silvers decline and sentiment now seems to have turned more negative on PM stocks. The lesson from this trade is to work out my stop position better before opening the trade so I don’t have to consider giving it more room.

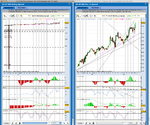
The 30 minute chart of the whole trade is attached.
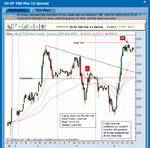
 

Attachments

  • HL_30min_14-1-11_exit.png
    HL_30min_14-1-11_exit.png
    29.7 KB · Views: 202
Account Update

January has not been good for me so far. Five losses in a row and and the current open position in the SP 500 Mar 11 Spread is currently losing. I need to really have a look at my entries and exits on the short term trades as I’ve been letting winning positions turn into losers all week. I think it’s because I’ve been using the 4 hour chart for my signals, but I have been trading intra day this week with very tight stops and have been whipsawed out of a number of trades by the market noise. So I need to make a change as I can’t monitor the positions all day as I have to work, so I think I will need to place stop losses further away in order to give the trades a bit of room to work.

The weekly performance for my account was -0.94%. Which means the account is now at +0.89%.

My open trades risk is 0.25%, and I have 0.32% risk left available to trade with until I hit my max draw down for January.

Attached below is the trades spreadsheet so far for January, my equity curve and the relative performance charts versus the S&P 500 and the FTSE 100.

The Black swan risk on the trades spreadsheet is actually half of what it is, as I hadn’t updated the position size when I did the screen shot.
 

Attachments

  • Trades_spreadsheet_14-1-11.png
    Trades_spreadsheet_14-1-11.png
    9.7 KB · Views: 194
  • Equity-Curve_14-1-11.png
    Equity-Curve_14-1-11.png
    7.8 KB · Views: 216
  • Relative_vs_SP500_14-1-11.png
    Relative_vs_SP500_14-1-11.png
    18.1 KB · Views: 209
  • Relative_vs_FTSE100_14-1-11.png
    Relative_vs_FTSE100_14-1-11.png
    19.7 KB · Views: 195
Hi there! I'll jump a bit into your journal with my thoughts. I'll present my view, in no way I mean to criticize you or trying to be smart as I am learning myself, I just try to present what my eyes see. In my opinion the entry you took can not be worse. Here is why:

1048.gif


1. You entered right before the resistance pivot zone (look at the blue square, do you see bar highs where blue arrows are, there price bounced down.

2. Now look at the high of the bar that first reddish arrow is pointing to, it is lower then previous highs on blue arrows. This means that price was running out of strength, it made LH (Lower High)

3.When price hit first reddish arrow it bounced from important EMA (not a good sign to go North, + you generally try to avoid situations where price is caught between important EMAs if they are very much together

4. But OK, you entered, then you should have noticed that second arrow is pointing to another LH, another sign that price is running out of power to go North + bounce from the EMA. At this point you were still in positive, I wonder why didn't you set trade to Break Even. Try to do this as soon as possible (I don't know this SP 500, with FX pairs I go Break Even at 12 pips, I use automatic system that does this for me, so I don't have to sit in front of screen)

5. If you look from the distance you will see letter "M" and the two reddish arrows are pointing to the highs of "M", this is right at resistance and is a sign that price is going down.

So I gave you here 4 reasons why I would not go long but would be actually interested in going short after "M" and this only from reading the price chart and EMAs, no other indicator. I urge you to reconsider if indicators you use are of any value at all, as is is evident that they deceived you. Take care and good luck!!

Thanks for the feedback pingvin123. It’s one of the major reasons why I post the trades in my journal. As I want to learn to be better and am interested to see other traders analysis and how they would have traded it. On question 4 you asked why I didn’t get out at breakeven. The reason for this was that the stock opened below breakeven on 12th Jan. The chart doesn’t show the gaps, but this is a problem with trading stocks overnight as they can open anywhere, and unfortunately I had to go to work so couldn’t monitor it intraday. So when I got home and checked it was still below breakeven, so I chose to stick with my initial stop and let it play out. With regards to the indicators, they were actually right on this one. I just ignored them unfortunately. MACD didn’t get above 0 and turned down and RSI broke below the trendline and couldn’t get back above it so it signaled to sell. I agree with your analysis it was just less clear at the right edge of the chart when the price was moving and I missed it on this one.

I really appreciate the comments. Thanks for taking the time to do it and I hope you’ll analyze some more of my trades in the future as it’s really helpful and what forums like this should be about. :)

I think you should have been out by 1000-1015. Keep a good eye on the price action, as you can see from that diagonal line pinguin drew. If the price is forming patterns like that it will suggest theres a very good chance of it breaking that line. If it breaks that line then there's a likelihood of it testing the lows, as there arent many other pivot points. I trade currencies mainly and i see it alot, double bottoms. If price makes a low and bounces strong don't buy it. It's not what you want to see. It's called a short squeeze, which just means the stock is changing hands from retail to institutional. Make sure you dont buy too close to resistence and sell too close to support. You can always keep your long or short view on the stock, but there's a good chance that you will be able to buy the stock for a cheaper price, or sell at a higher price.

How i see price action.

Price action makes lows and bounces sharply - theres a good chance of it making lower lows. Retail shorts get squeezed out. Institutional traders now short, as they get stopped out, and others buy.

Price action makes lows and bounces a small amount - Watch the price action, if the price stays above the lows for a long enough time frame theres a good chance of a retest of the lows and potential buying opportunity. Perfect on highly liquidity low volatile days.

Thanks brettus. I really appreciate all the feedback. I will try my best to post all my trades and hopefully will improve with some time and experience.
 
Thanks brettus. I really appreciate all the feedback. I will try my best to post all my trades and hopefully will improve with some time and experience.

The annoying thing about trading is that if you dont actively participate, you can never learn to trade and make money. Why is that we need to trade for months and years before we can learn from our mistakes? You learn that when you were fearful, you should have been greedy and fearful when you were greedy.

That's all it takes really, time, experience and screen time and don't do your ******** in that time!
 
Re: Money Management

However if I go short the risk is much higher on individual shares as a bid or some other news could send it through the roof. So my aim is to only go short on the SP 500 spread as the probability of that going up 100% or more instantly is very low, but could still happen someday. A Flash spike caused by the trading machines maybe or something no one’s thought of yet.

I must admit i've decided my short strategy on stocks is to always use a guaranteed stop, as although underlying market prices are extremely unlikely to gap several 100%, spread betting prices can. I've found many historical examples of gaps of 500+%...
 
You are frightening me! I've been trading for decades and that has not happened to me. I'm not saying that you are wrong and it is, certainly, something that I must look into. It only needs to happen once, of course!
 
Re: SP 500 Short Entry – Mar 11 Spread

I’ve gone Short the SP 500 Mar 11 Spread

Entry Price: 1264.80
Stop: 1273.20
Target: 1225.00

Risk/Reward Ratio: 4.74

You asked to analyze more charts/trades that you took, here is one more, the first chart that you posted I think... I can see the reason (I think) why you went short there, it is a resistance zone (at the top of the yellow arrow). Or maybe that was not the reason, it doesn't matter, I would like to point you to the important pin bars on this chart (from left to right):

1049.gif


- First reddish arrow pointing to the pin bars, price got rejected at 1250, you enter those a few pips above the pin, SL being a few pips below the pin. Would it work out? Yes on all 3 pins.

- Two bluish arrows pointing to the pins, price bounced from EMA, you can enter straight at EMA touch or wait for the pin to break. Would it work out? Yes on all 5 pins.

- Second red arrow pointing to the pin on the top, that one would work nicely as well, depends how you want to play it it you would move SL on the highs of 2 pins behind the price or expect retrace to probably go till your entry + a few pips in minus. I would close it probably and reenter on the highs of retracement after the yelow arrow.

- Yellow arrow pointing to the pin, that one would work as well if you would place position to BE or take TP at the bottom of the previous high. Do you see where the price retraced? Right till there!

- Last red arrow pointing to the pin at pivot zone 1260 (look at the left, see how the price stalled there, and now price got rejected from this zone). If I would still have short position open from the second red arrow or from the highs after yellow, this is where I would definitely close the positions and went long. Again depends how you want to play it, but most probably my TP would be previous bar lows (although the move up was very forceful, long bars, so I might have waited a bit as well). I would not dare to go short there, Price action does not support short trade at this time.

That's all from me, I hope you will find my input helpful. Take care!
 
You are frightening me! I've been trading for decades and that has not happened to me. I'm not saying that you are wrong and it is, certainly, something that I must look into. It only needs to happen once, of course!

I must admit I was a bit surprised, but I was doing some investigating last night on my IG account browsing some random charts and found several (4 or 5) stocks with huge spikes, unsurprisingly most were around Oct/Sep 2008. For example try looking at Dolby Laboratories Sep 4 2008. Now these must be down to the way the SB company calculates "their price", and I don't know how valid they are and whether if you challenged them they would say they were errors...? I am going to email IG to query. But it does concern me if I was going short...
My CityIndex chart of Dolby Labs does not show such a spike for example. So to what degree could IG say, well that's "our price" tough...?

Are these stock splits?
 
The first company I used for trading was IG. This was in the 80s and I lost 60 points and was stopped overnight. I rang them and they told me that it was legitimate and were sorry and that was that. I did not argue about it but switched to CI and, then, to Fins where I have been since before they went online, which is a long time! Trading conditions have been steadily improving since then , probably due to competition. Most of the spikes I see seem to be backed in other sources. Nevertheless, BS firms are not angels and any complaint that I read is a nudge for me to watch it and not be too trustfull.
 
Re: Money Management

I must admit i've decided my short strategy on stocks is to always use a guaranteed stop, as although underlying market prices are extremely unlikely to gap several 100%, spread betting prices can. I've found many historical examples of gaps of 500+%...

I’m not sure if you understood what I meant when I said about my risk method when shorting. Individual stocks can spike 500%+ like you described, so I’d stay away from them if they didn’t have the option to use a guaranteed stop. However, what I was saying was that the S&P 500 Index has never spiked more than 100% instantly as far as I know, so I feel much more comfortable to be able to use normal stops on it as the likelihood of that happening is very low.
 
Last edited:
Below is the 4hr charts of the S&P 500 Rolling Spread and the S&P 500 Mar 11 Spread. It shows a huge down spike on the rolling spread. Would this have taken out a stop at a much lower level. I don’t know. Or is it just a mistake in their charts?
 

Attachments

  • Picture 5.png
    Picture 5.png
    178.1 KB · Views: 260
Last edited:
Below is the 4hr charts of the S&P 500 Rolling Spread and the S&P 500 Mar 11 Spread. It shows a huge downspike on the rolling spread. Would this taken out a stop at a much lower level. I don’t know. Or is it just an mistake in their charts?

Surely a mistake, otherwise you could clean up.
 
Are these stock splits?

I don't think so, google doesn't show a split then and IG charts show a step in price for them, not a spike.
I suspect it was an exchange opening spread/price irregularity due to the conditions back in 2008.
 
I don't think so, google doesn't show a split then and IG charts show a step in price for them, not a spike.
I suspect it was an exchange opening spread/price irregularity due to the conditions back in 2008.

They never sort out the charts, so i can understand why you question it.
 
Re: SP 500 Short Entry – Mar 11 Spread

You asked to analyze more charts/trades that you took, here is one more, the first chart that you posted I think... I can see the reason (I think) why you went short there, it is a resistance zone (at the top of the yellow arrow). Or maybe that was not the reason, it doesn't matter, I would like to point you to the important pin bars on this chart (from left to right):

1049.gif


- First reddish arrow pointing to the pin bars, price got rejected at 1250, you enter those a few pips above the pin, SL being a few pips below the pin. Would it work out? Yes on all 3 pins.

- Two bluish arrows pointing to the pins, price bounced from EMA, you can enter straight at EMA touch or wait for the pin to break. Would it work out? Yes on all 5 pins.

- Second red arrow pointing to the pin on the top, that one would work nicely as well, depends how you want to play it it you would move SL on the highs of 2 pins behind the price or expect retrace to probably go till your entry + a few pips in minus. I would close it probably and reenter on the highs of retracement after the yelow arrow.

- Yellow arrow pointing to the pin, that one would work as well if you would place position to BE or take TP at the bottom of the previous high. Do you see where the price retraced? Right till there!

- Last red arrow pointing to the pin at pivot zone 1260 (look at the left, see how the price stalled there, and now price got rejected from this zone). If I would still have short position open from the second red arrow or from the highs after yellow, this is where I would definitely close the positions and went long. Again depends how you want to play it, but most probably my TP would be previous bar lows (although the move up was very forceful, long bars, so I might have waited a bit as well). I would not dare to go short there, Price action does not support short trade at this time.

That's all from me, I hope you will find my input helpful. Take care!

Thanks again pingvin123. I’ve updated the chart and attached below to show the whole trade on the chart from the 4th Jan. My entry reasons were that price had retraced to value (the moving averages) after a strong down move and were at a resistance area that you mentioned. I was looking for for a retest of the lows and a breakdown through them. Which proved too be a bit to ambitious as the price tested the lows and then reversed on the 1pm bar on the 5th Jan and moved up strongly during the US session. I wasn’t able to monitor my position due to internet problems so was stopped out at my initial stoploss.
 

Attachments

  • SP500_30min_4-1-10_exit.png
    SP500_30min_4-1-10_exit.png
    21.9 KB · Views: 263
Surely a mistake, otherwise you could clean up.

I guess all of these must be errors, no standard trade would go through at these prices, ie. they are just SB manufactured prices. It's just worrying they happen, and what's to say the SB company would say tough..
 
Top