isa's short term trading journal

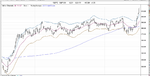
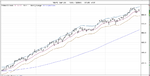
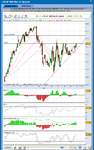
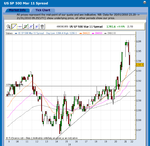
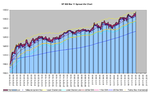
S&P 500 Trades – Jan 11 Week 2

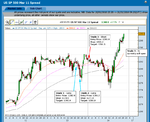
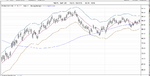
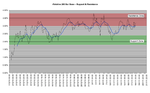
Attached is my trades in the S&P 500 Index this week. Both closed positions were losers and the current open position is currently negative as well. I have given the stop loss more room as I think the market is getting a bit old after 7 up weeks. But the short term price action still looks positive, so I’m going to wait and see what Mondays price action looks like before moving the stop down or closing it.

Constructive critique of the trades would be appreciated.
 

Attachments

  • SP500_30min_trades_wk2.png
    SP500_30min_trades_wk2.png
    22.1 KB · Views: 226
Open position update

Attached is the chart of my current open position in the US SP 500 Mar 11 Spread (S&P 500 Index). I don’t expect a lot to happen today because the US markets are closed.

I’ve moved my target to breakeven.
 

Attachments

  • SP500_30min_17-1-11_open.png
    SP500_30min_17-1-11_open.png
    30.3 KB · Views: 233
Last edited:
Re: Open position update

Attached is the chart of my current open position in the US SP 500 Mar 11 Spread (S&P 500 Index). I don’t expect a lot to happen today because the US markets are closed.

I’ve moved my target to breakeven.

Attached is the updated 30 minute chart of the US SP 500 Mar 11 Spread. European markets are closed now and US is closed today, so I don’t expect much else to happen until the Asian session tonight. However, I would be interested to see someone else's opinion of the price action at the moment on the chart. From what I can see it broke down through the first uptrend line but rebounded at the 100 bar EMA and is now between the 22 and 50 bar EMAs just below the down trend line. So I’m not willing to do anything until it breaks in either direction. Thoughts anyone?
 

Attachments

  • Picture 10.png
    Picture 10.png
    47.7 KB · Views: 227
1282 through 1284 seems to me as a pivot zone. And look what happened, you got a bullish pin right from this zone. But not all is bad, the bar before the pin is very long and pin has a small nose, plus there is a traffic zone after the pin, I would not go long here after this pin, so it could work in your favor, but I have no experience in stocks. Good luck and keep us posted!
 
1282 through 1284 seems to me as a pivot zone. And look what happened, you got a bullish pin right from this zone. But not all is bad, the bar before the pin is very long and pin has a small nose, plus there is a traffic zone after the pin, I would not go long here after this pin, so it could work in your favor, but I have no experience in stocks. Good luck and keep us posted!

Just an interesting fact. Every pre election year for the last 100 years has been positive for the S&P and averaged returns of 20%. Maybe an idea for bias when trading. I don't know. I don't want to influence you that much.
 
Just an interesting fact. Every pre election year for the last 100 years has been positive for the S&P and averaged returns of 20%. Maybe an idea for bias when trading. I don't know. I don't want to influence you that much.

I’ve read a fair bit about this recently and there was an article on another site which I read. I have attached their backtest data. It looks very positive, yet from looking back at the charts I can see that a lot of the gains were during very short periods during the years, so I’m going to do my own chart study as I think the figures don’t show the whole picture.
 

Attachments

  • 19400_b.png
    19400_b.png
    18.9 KB · Views: 279
I’ve read a fair bit about this recently and there was an article on another site which I read. I have attached their backtest data. It looks very positive, yet from looking back at the charts I can see that a lot of the gains were during very short periods during the years, so I’m going to do my own chart study as I think the figures don’t show the whole picture.

Thanks for that. Looks like its not as good as i've heard. Interesting none the less. There's another interesting fact. I might delve into that later.
 
1282 through 1284 seems to me as a pivot zone. And look what happened, you got a bullish pin right from this zone. But not all is bad, the bar before the pin is very long and pin has a small nose, plus there is a traffic zone after the pin, I would not go long here after this pin, so it could work in your favor, but I have no experience in stocks. Good luck and keep us posted!

I was thinking that this chart looked a bit like the reverse of the Hecla Mining chart you analyzed the other day, and that a possible retest of the highs needed to happen before it could make a bigger reversal down?
 
S&P 500 Presidential Year Charts

Attached is the S&P 500 charts of the 3rd Year in office of the President since 1975. I think these show it better than back test data.
 

Attachments

  • Picture 16.png
    Picture 16.png
    77.6 KB · Views: 224
  • Picture 17.png
    Picture 17.png
    86.8 KB · Views: 181
  • Picture 18.png
    Picture 18.png
    71.8 KB · Views: 272
  • Picture 19.png
    Picture 19.png
    80.5 KB · Views: 222
  • Picture 20.png
    Picture 20.png
    81.2 KB · Views: 226
  • Picture 13.png
    Picture 13.png
    97 KB · Views: 201
  • Picture 12.png
    Picture 12.png
    85.3 KB · Views: 189
  • Picture 14.png
    Picture 14.png
    90.4 KB · Views: 210
  • Picture 15.png
    Picture 15.png
    62.3 KB · Views: 250
Last edited:
Re: S&P 500 Presidential Year Charts

Attached is the S&P 500 charts of the 3rd Year in office of the President since 1975. I think these show it better than back test data.

I think the charts show that if you bought at the start of year and held you’d have made a good return in most of the years. However, the market was completely different in all of those years and another method for short term trading would have been to buy the pivots below the 200 day moving average IMO.
 
Last edited:
I was thinking that this chart looked a bit like the reverse of the Hecla Mining chart you analyzed the other day, and that a possible retest of the highs needed to happen before it could make a bigger reversal down?

You are correct, it is similar, but not exactly. On Hecla Mining I would be interested in shorting at second blue and on second red arrow. There were pins. Check the bar before the pin. They were equal or smaller size, to me it means that price was running out of power, pin followed and price reversed. The situation with the recent chart is that bar before the pin is much bigger then the pin, powerful. I think that price will again retest highs at 1284, and might descend to your BE. But this is just my view, may not happen like that.
 
Re: S&P 500 Presidential Year Charts

I think the charts show that if you bought at the start of year and held you’d have made a good return in most of the years. However, the market was completely different in all of those years and another method for short term trading would have been to buy the pivots below the 200 day moving average IMO.

Yep 1995 would be nice.
 
You are correct, it is similar, but not exactly. On Hecla Mining I would be interested in shorting at second blue and on second red arrow. There were pins. Check the bar before the pin. They were equal or smaller size, to me it means that price was running out of power, pin followed and price reversed. The situation with the recent chart is that bar before the pin is much bigger then the pin, powerful. I think that price will again retest highs at 1284, and might descend to your BE. But this is just my view, may not happen like that.

Thanks pingvin123. I was thinking a similar train of thought. Although news and data could change it, so will let it play out a bit more as the stop loss has room for now.
 
Re: Open position update

Interesting triangle formation in the price action. Think a break could be coming soon.

The consolidation triangle pattern led to a strong break out higher. There was a shakeout around 8pm, but it pivoted at the 100 bar EMA. So it produced a solid 5 point move in an hour. Will definitely be a pattern to look out for in the future.

Attached is the chart
 

Attachments

  • Picture 3.png
    Picture 3.png
    45.7 KB · Views: 194
Re: Open position update

Price action is getting precariously close to my stop loss on US SP 500 Mar 11 Spread. However, price is very close to the top of the channel, which normally holds it at bay, so with any luck the rally will lose steam here.
 

Attachments

  • Picture 4.png
    Picture 4.png
    170.5 KB · Views: 197
Support and Resistance

I’ve been manually typing into Excel the spread betting prices from the 4 hour chart of the US SP 500 Mar 11 Spread for the last few months. The purpose of this is so I can set stop losses and price targets using the spread betting companies actual prices, so that I’m not stopped out by slight variations between the futures price and the spread betting companies price.

From this I’ve been able to produce a graph which is simply the distance from the 200 bar simple moving average. I like to use this on my daily stock charts using the 200 day SMA as the baseline, as it is very useful at identifying areas of support and resistance. So I thought it would be interesting to see if it was as effective on a different time frame.

What it shows is that since the current bull move started at the beginning of December that price has met resistance between 3 to 3.8% above the 200 bar SMA and support has been around the 2% area above the 200 bar SMA. It will be interesting to see how this develops as I continue to put new prices in, but I think it shows that a strong break below 2% level will be a signal to go short.

Price is currently at 3.43% above the 200 bar SMA and so a short term top is likely soon maybe?
 

Attachments

  • rRelative-Support-Resistance.png
    rRelative-Support-Resistance.png
    38.8 KB · Views: 208
Last edited:
Top