isa's short term trading journal

Good!

But volume I dont use. Volume doesnt tell anything. For every sll there is a buyer and conversely. So volume shows volume of exchange not direction or conviction as some people tend to believe. Indeed certain high volume after some days of rally could be smartmoney distributing..and so certain large volume after selloffs means accumulation by them. It is quite tricky.
It is possible to know when market turns or is turning. That is a trader for you. Market trends about 15% and ranges for about 80%. How can one make money if you cannot find inflexion points? Or trade ranges..which is bsically trading off turning points. A market can trade in ranges for months! It is rather impossible to tell if a move is a trend b/cos if it is not the trader ends up buying top of a range :) SNP500 is widely followed and inflexion points ar easily known...trade other stocks in that contxt by selling tops and buying bottoms. Except for small caps..capitalised stocks follow the market

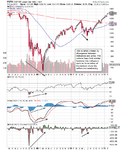
See the attached S&P 500 weekly chart. It shows a very obvious example of what I mean when I say a divergence between price and volume. The volume bars as you say don't show it, but force index which is a different way of representing volume does very clearly. This chart shows why I think divergences in indicators are useful as a divergence on a weekly timeframe between indicators and price shows when the strength of a trend is weakening. I use it with good results on a daily and weekly timeframe by looking for divergences on the weekly timeframe, and then moving to the daily and intraday timeframes to gauge price action. It is a method that I find useful, Like everything in this game it won't suit everyone, but it helps me with my decision making process.
 

Attachments

  • $SPX.png
    $SPX.png
    29.8 KB · Views: 141
Last edited:
See the attached S&P 500 weekly chart. It shows what I mean when I say a divergence between price and volume. The volume bars as you say don't show it, but force index which is a different way of representing volume does very clearly. This is why I think divergences in indicators are important and I use it with good results on a daily and weekly timeframe.

I dont look at indicators. They are meaningless. They change from one timeframe to another. Just beauty in the eyes of the beholder. Other do. That is just me. I used quite alot b4 and in the end I do now know what makes sense. It does look fine when presented especially in th longer time frame. But for indicators...it is same for small time and lage time...just numbr of occurences. I am driving. Yes I need to look at the rear view mirror but my concentration must be on the windshield!
I was there i march low and that was expected. The first signal of the turn was Novermber 2008 and the next was in early march. Many large stocks turned b4 March lows. Risk was on currencies shortly before then.
But then March low is a larger timeframe that the uptrend is still in play. I trade short term swings so I look for snp turns 4~10 times in 1 year. If risk continue to unwind in CHF and YEN, could see SNP 4400 b4 the downside 1220. This one is pure speculation. I dont forecast..
Good luck!
 
I dont look at indicators. They are meaningless. They change from one timeframe to another. Just beauty in the eyes of the beholder. Other do. That is just me. I used quite alot b4 and in the end I do now know what makes sense. It does look fine when presented especially in th longer time frame. But for indicators...it is same for small time and lage time...just numbr of occurences. I am driving. Yes I need to look at the rear view mirror but my concentration must be on the windshield!

I don't want to get into an argument about indicators in my trading journal. I find them useful, you don't. So enough of that now, as this is my journal thread not a general trading chat thread. I would recommend you actually read through my journal as you will see that almost every trade was posted on the thread on the day I entered and exited and that I show my charts with the indicators present so the comment about looking in the rear view mirror is mistaken, I was just using the S&P 500 example as an obvious example as you didn't seem to understand what I meant by a divergence between the price action and the indicator patterns. I would recommend you read Come into my Trading Room by Elder, as this talks about divergences in great detail. I wish you good luck with your trading, but I think we clearly have different methods of selecting trades and will most likely never agree.
 
I don't want to get into an argument about indicators in my trading journal. I find them useful, you don't. So enough of that now, as this is my journal thread not a general trading chat thread. I would recommend you actually read through my journal as you will see that almost every trade was posted on the thread on the day I entered and exited and that I show my charts with the indicators present so the comment about looking in the rear view mirror is mistaken, I was just using the S&P 500 example as an obvious example as you didn't seem to understand what I meant by a divergence between the price action and the indicator patterns. I would recommend you read Come into my Trading Room by Elder, as this talks about divergences in great detail. I wish you good luck with your trading, but I think we clearly have different methods of selecting trades and will most likely never agree.

I am not into debate. Just a contribution. I am sorry if you do not appreciate that. I do not mean any offence at all. I went thru your performance and thought u could dramatically improve if you can consider some inputs. Your target strategy is quite good. Your read on the snp was against trend for a while, maybe due to divergeance or any oscillator. I have been in this business in many levels for sometime and just expressing my own experience. I trade snp500 actively with high sharpe ratio.

Pls be well and good luck.
 
Last edited:
I am not into debate. Just a contribution. I am sorry if you do not appreciate that. I do not mean any offence at all. I went thru your performance and thought u could dramatically improve if you can consider some inputs. Your target strategy is quite good. Your read on the snp was against trend for a while, maybe due to divergeance or any oscillator. I have been in this business in many levels for sometime and just expressing my own experience. I trade snp500 actively with high sharpe ratio.

Pls be well and good luck.

I do appreciate the advice and I wasn't offended, I just didn't want to get into a big debate about it as I know many people doing well that do use indicators, divergences etc, so what I meant was it's a debate for separate thread.

I'm still learning and developing my methods so I'm always interested to see how others trade. What you said originally mostly made sense, but I don't agree on not having a stop loss as this was the sole reason I blow up a few small accounts when I first began trading in 2007. Now days I'm happy to take a small loss and miss a bigger move as protecting my account is the priority.

Thanks again for the input.

Hi Isatrader, Thanks for your nice reply. Please be aware that I do not subscribe to non-use of stop losses. You need stop losses to avoid crash like situation. It only means your stop must be as large as possible to avoid volatility. However if market keeps trading above your price level for a resonable time you must get off at a good position. Usually price tend to restest those levels again b4 a move.
Take for example snp500 Friday. The trading range has been 325 and 311. It broke out of 325 on Egypt settlement news to as high as 327/8. It still cam down to 324/5 b4 the move to 332. I had a short position @324 with stop @350. When it broke out, I watched the price action on the pullback and was off the trade without loss and then switched long. I just used 350 stop just to avoid crash to the upside LOL. I use mental stop effectively to manage trades. But I hate news or unpredicatable events to get me off good trades. That was my greatest killer in my early days
 
BG Group is still ticking higher and is 3 x the average true range above my entry now, so I've moved my stop loss to break even. That means I've got available risk again to open new positions, so today I'm watching, SN.L, BARC.L and MLC.L for a possible entry point.
 
Barclays Jun 11 Spread Entry

Below is the full trade details for my Barclays trade

Trade

Barclays Jun 11 Spread
Direction: Long

Entry Price: 309.31
Spread: 0.91

Stop: 286
Target: 385

Account Risk: 0.29%
Potential Account Profit: 0.94%
Risk Ratio: 3.27
 

Attachments

  • BARC-30min_14-2-11_entry.png
    BARC-30min_14-2-11_entry.png
    29.5 KB · Views: 144
  • BARC-Daily_14-2-11_entry.png
    BARC-Daily_14-2-11_entry.png
    28.7 KB · Views: 149
Top