Hellena Trade
Well-known member
- Messages
- 272
- Likes
- 48
#GBPUSD
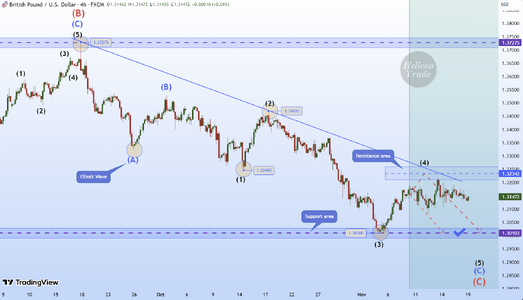
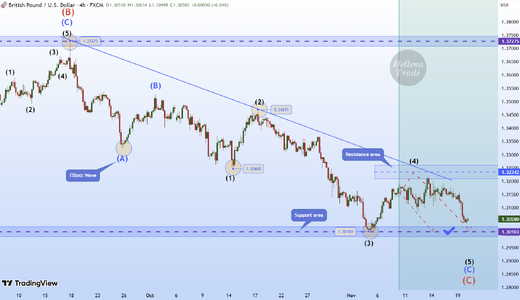
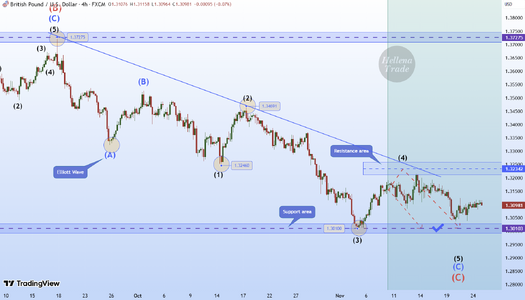
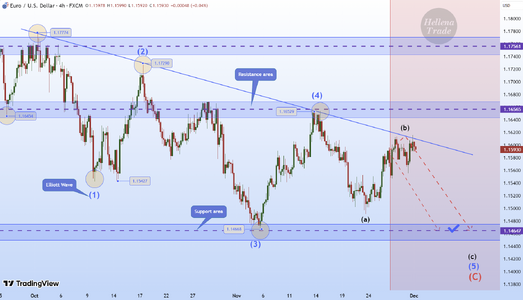
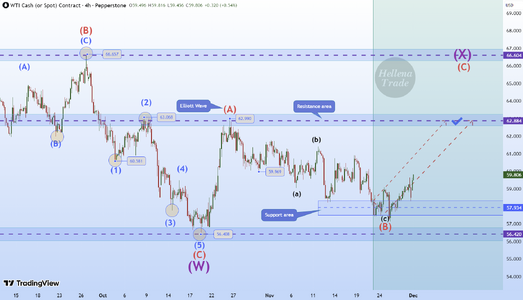
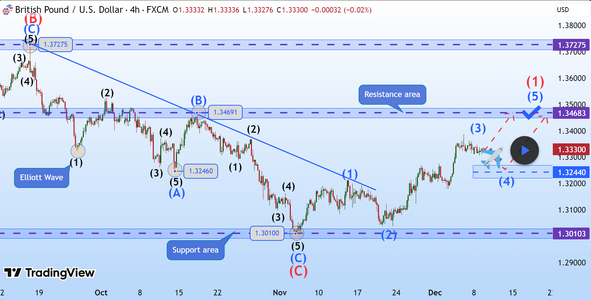
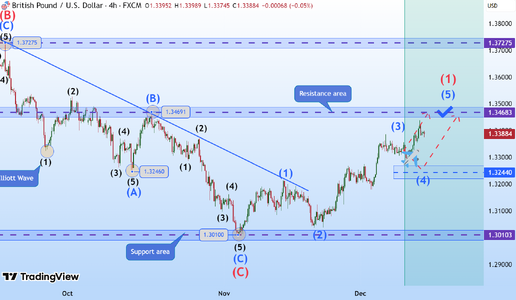
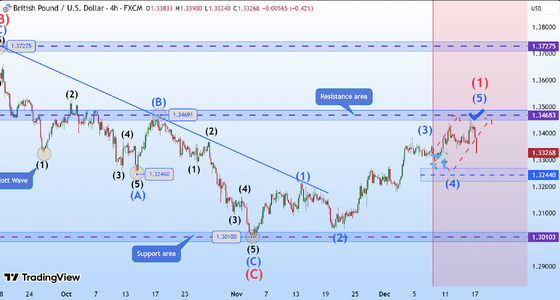
🔔(UPDATE) GBP/USD (4H): SHORT to min wave "4" area 1.30100.
➖➖➖➖➖➖➖➖➖
➡️Consolidation of the flat price has been delayed, but I am not in a hurry to cancel the forecast. I believe that by the end of the week we will see a breakout of the conditional flat boundaries (1.32143 and 1.30846).
Of course, to a greater extent I count on overcoming the level of 1.30846 after which trades will be set to breakeven.
#SPX500
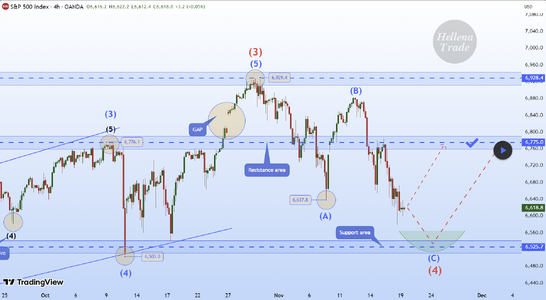
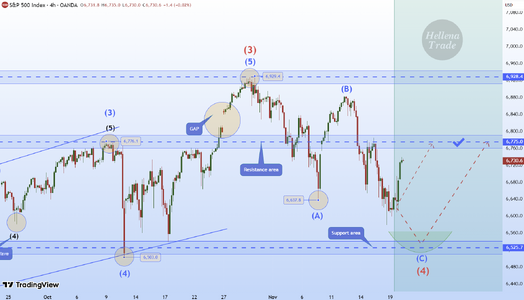
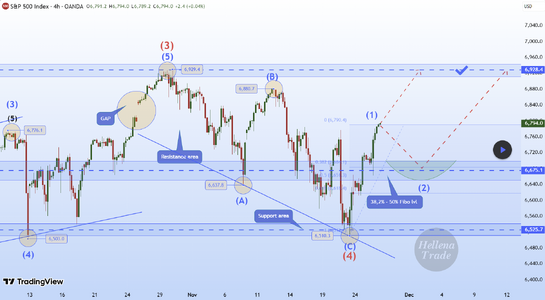
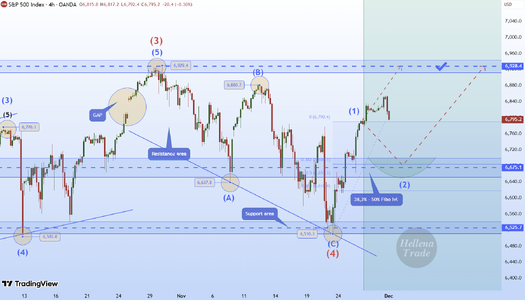
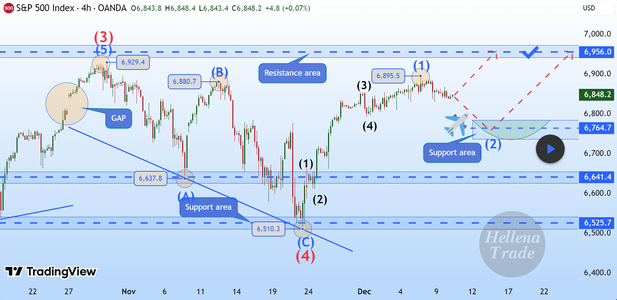
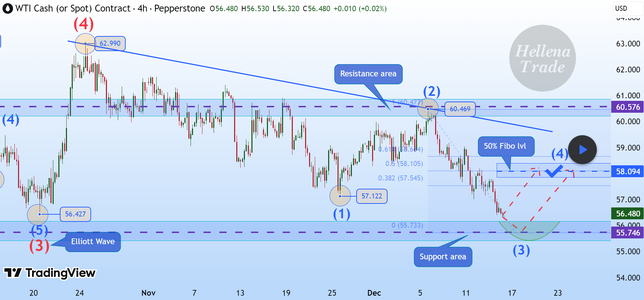
5️⃣ SPX500 (4H): LONG to resistance area of 6775.
➖➖➖➖➖➖➖➖➖
➡️Dear colleagues, according to the last forecast the price is at the support level, but as it turned out, the correction in wave “4” is a bit more complicated than I thought.
Wave “4” consists of three waves “ABC” and should be over soon. The upward movement is still in priority, but I will target the not so distant resistance area of 6775.
Once it is reached, we will think about how to reach higher levels.
#GOLD
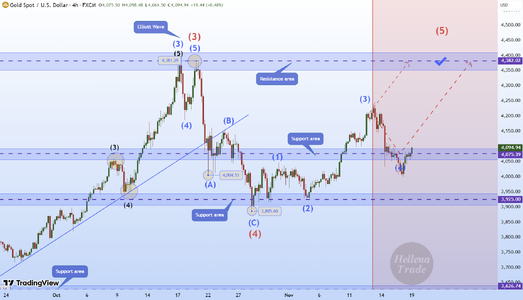
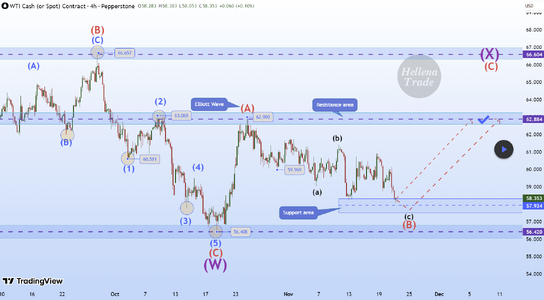
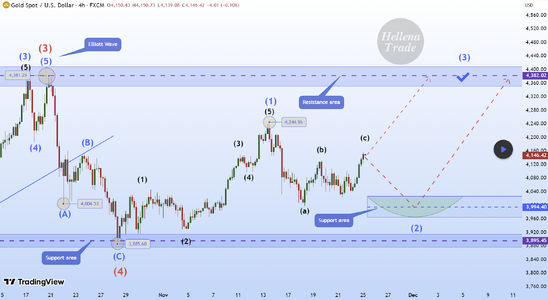
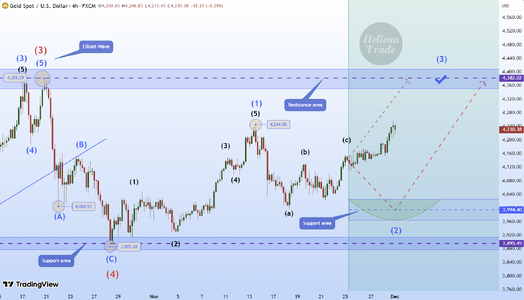
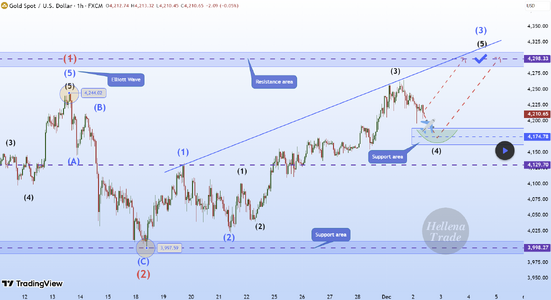
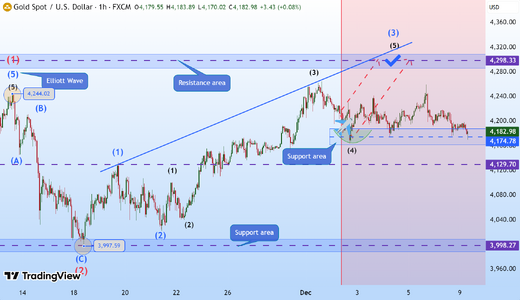
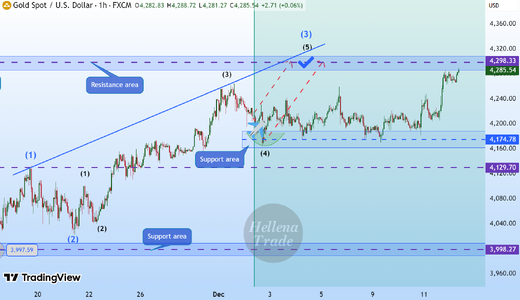
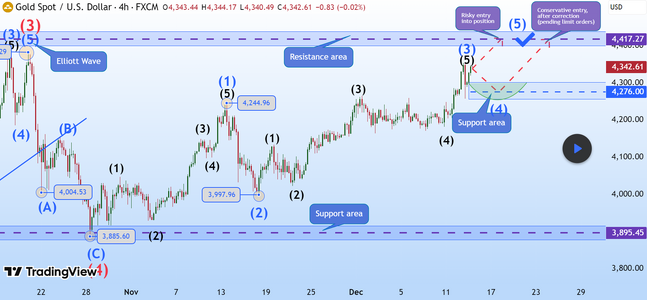
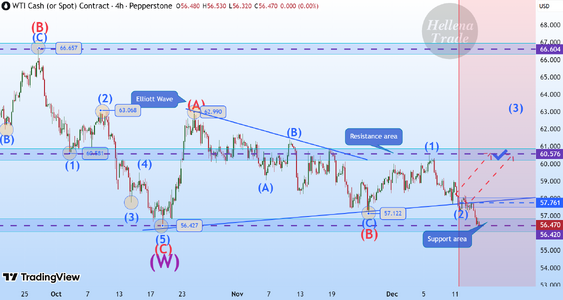
🔔(UPDATE)🥇 GOLD (4H): LONG to resistance area of 4382.
➖➖➖➖➖➖➖➖➖
➡️Colleagues, I know you have a lot of questions about overcoming the cost of the support area.
But I've always said that it's just an area, so there can be errors.
At this point, I expect the upward movement to resume despite the fact that there are some changes in the wave pattern for waves “12345”, where wave “4” has gone a bit further than expected.
If the price updates the local low of 3925 - the forecast will be canceled or revised.
🔔(UPDATE) GBP/USD (4H): SHORT to min wave "4" area 1.30100.
➖➖➖➖➖➖➖➖➖
➡️Consolidation of the flat price has been delayed, but I am not in a hurry to cancel the forecast. I believe that by the end of the week we will see a breakout of the conditional flat boundaries (1.32143 and 1.30846).
Of course, to a greater extent I count on overcoming the level of 1.30846 after which trades will be set to breakeven.
#SPX500
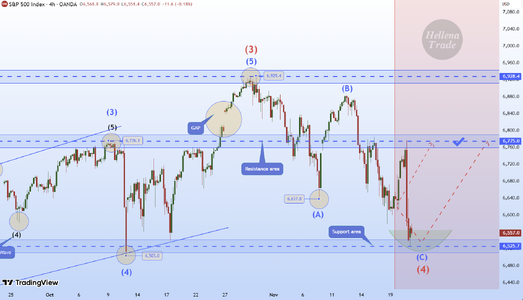
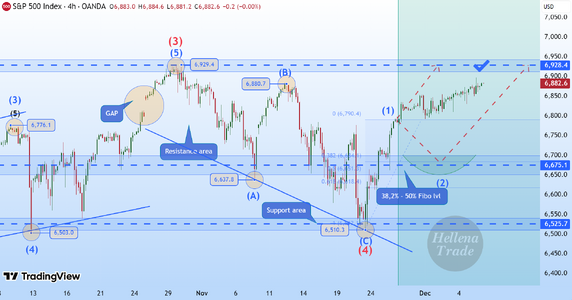
5️⃣ SPX500 (4H): LONG to resistance area of 6775.
➖➖➖➖➖➖➖➖➖
➡️Dear colleagues, according to the last forecast the price is at the support level, but as it turned out, the correction in wave “4” is a bit more complicated than I thought.
Wave “4” consists of three waves “ABC” and should be over soon. The upward movement is still in priority, but I will target the not so distant resistance area of 6775.
Once it is reached, we will think about how to reach higher levels.
#GOLD
🔔(UPDATE)🥇 GOLD (4H): LONG to resistance area of 4382.
➖➖➖➖➖➖➖➖➖
➡️Colleagues, I know you have a lot of questions about overcoming the cost of the support area.
But I've always said that it's just an area, so there can be errors.
At this point, I expect the upward movement to resume despite the fact that there are some changes in the wave pattern for waves “12345”, where wave “4” has gone a bit further than expected.
If the price updates the local low of 3925 - the forecast will be canceled or revised.