Hellen's thoughts

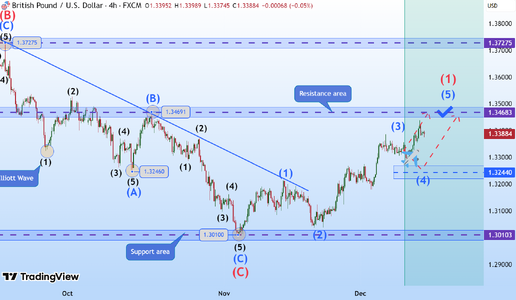
#GBPUSD
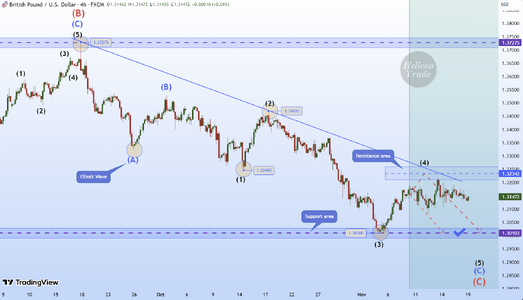
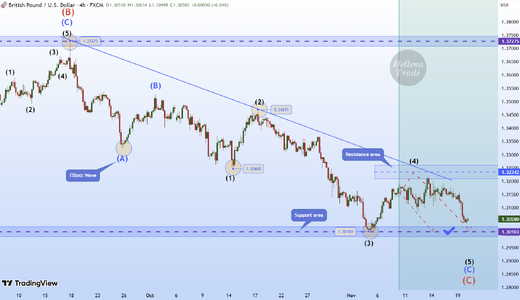
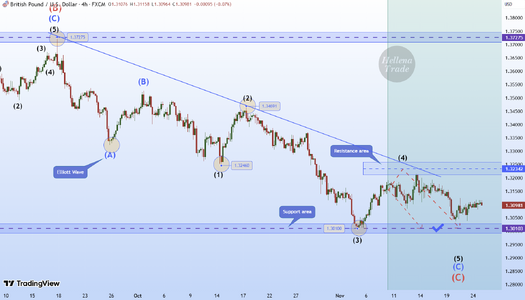
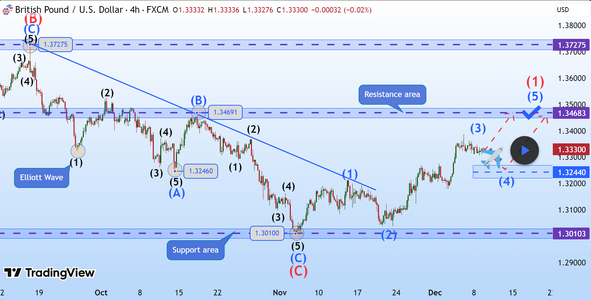
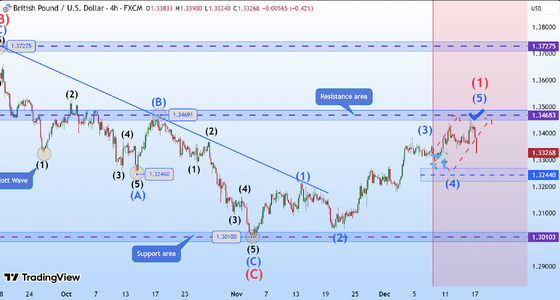
🔔(UPDATE) GBP/USD (4H): SHORT to min wave "4" area 1.30100.
➖➖➖➖➖➖➖➖➖
➡️Consolidation of the flat price has been delayed, but I am not in a hurry to cancel the forecast. I believe that by the end of the week we will see a breakout of the conditional flat boundaries (1.32143 and 1.30846).
Of course, to a greater extent I count on overcoming the level of 1.30846 after which trades will be set to breakeven.

#SPX500
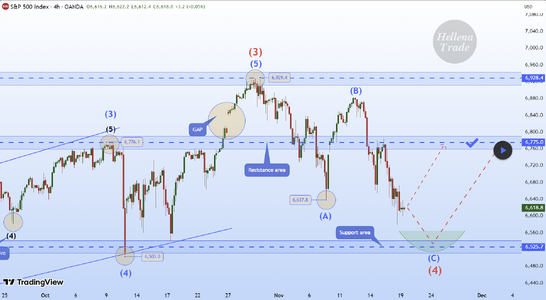
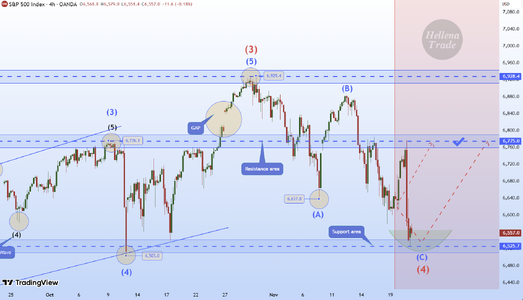
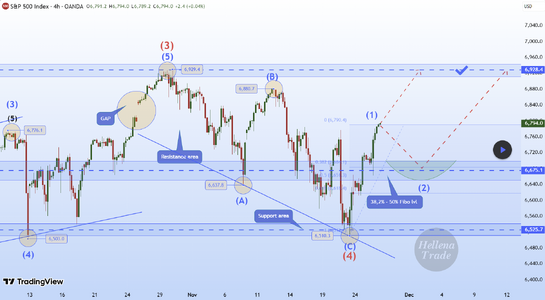
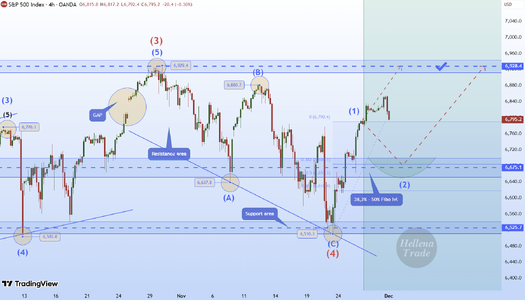
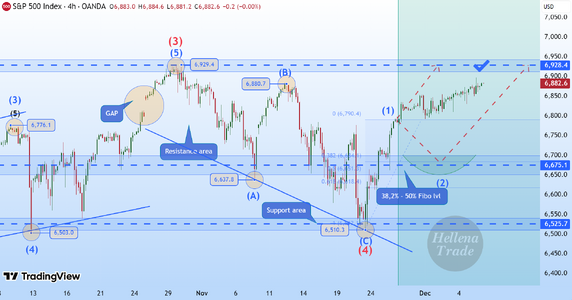
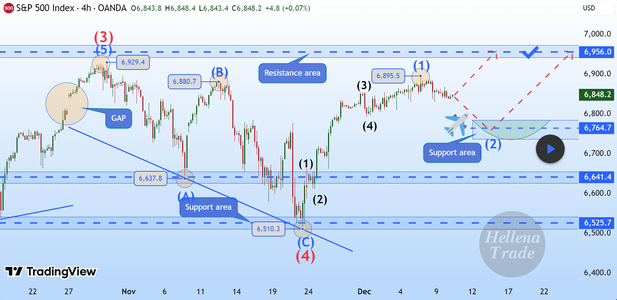
5️⃣ SPX500 (4H): LONG to resistance area of 6775.
➖➖➖➖➖➖➖➖➖
➡️Dear colleagues, according to the last forecast the price is at the support level, but as it turned out, the correction in wave “4” is a bit more complicated than I thought.
Wave “4” consists of three waves “ABC” and should be over soon. The upward movement is still in priority, but I will target the not so distant resistance area of 6775.
Once it is reached, we will think about how to reach higher levels.

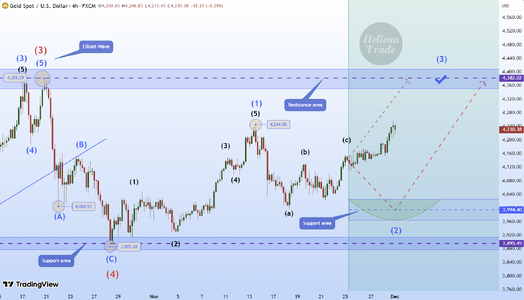
#GOLD
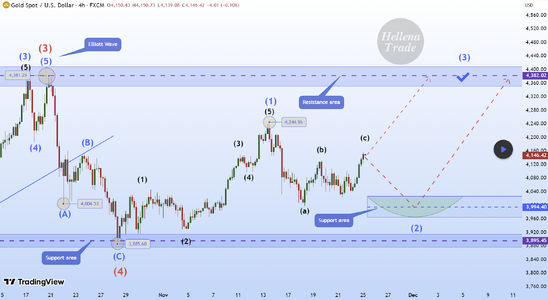
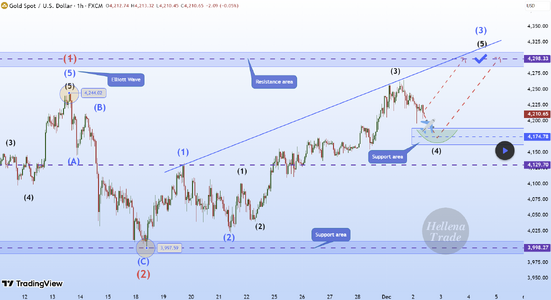
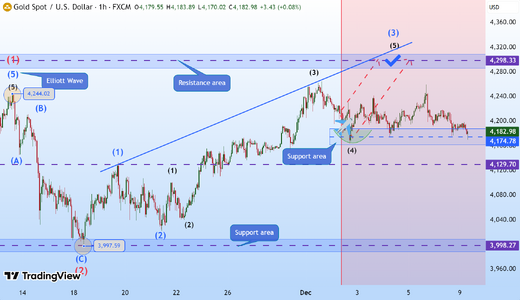
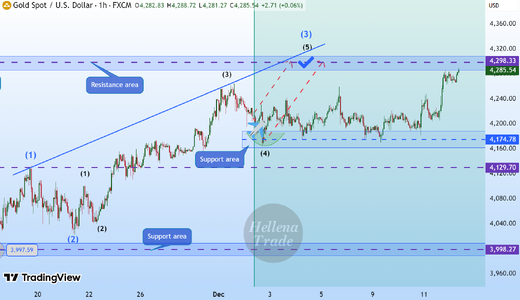
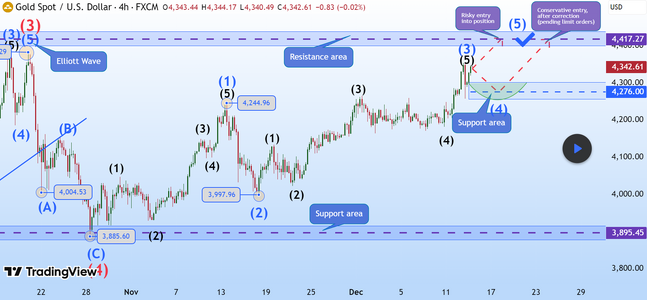
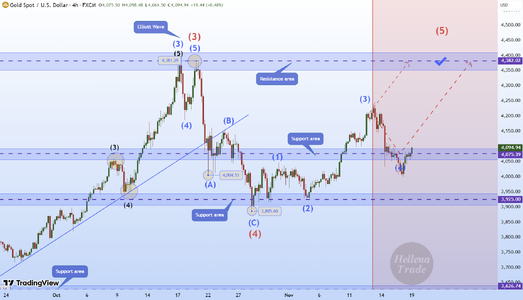
🔔(UPDATE)🥇 GOLD (4H): LONG to resistance area of 4382.
➖➖➖➖➖➖➖➖➖
➡️Colleagues, I know you have a lot of questions about overcoming the cost of the support area.
But I've always said that it's just an area, so there can be errors.
At this point, I expect the upward movement to resume despite the fact that there are some changes in the wave pattern for waves “12345”, where wave “4” has gone a bit further than expected.
If the price updates the local low of 3925 - the forecast will be canceled or revised.
 

Attachments

  • 2025-11-19_09-49-34.png
    2025-11-19_09-49-34.png
    182.1 KB · Views: 2
  • 2025-11-19_09-42-44.png
    2025-11-19_09-42-44.png
    166.4 KB · Views: 1
  • 2025-11-19_09-09-12.png
    2025-11-19_09-09-12.png
    182.3 KB · Views: 1
#GBPUSD
🔔(UPDATE) GBP/USD (4H): SHORT to min wave "4" area 1.30100.
➖➖➖➖➖➖➖➖➖
➡️Consolidation of the flat price has been delayed, but I am not in a hurry to cancel the forecast. I believe that by the end of the week we will see a breakout of the conditional flat boundaries (1.32143 and 1.30846).
Of course, to a greater extent I count on overcoming the level of 1.30846 after which trades will be set to breakeven.

#SPX500
5️⃣ SPX500 (4H): LONG to resistance area of 6775.
➖➖➖➖➖➖➖➖➖
➡️Dear colleagues, according to the last forecast the price is at the support level, but as it turned out, the correction in wave “4” is a bit more complicated than I thought.
Wave “4” consists of three waves “ABC” and should be over soon. The upward movement is still in priority, but I will target the not so distant resistance area of 6775.
Once it is reached, we will think about how to reach higher levels.

#GOLD
🔔(UPDATE)🥇 GOLD (4H): LONG to resistance area of 4382.
➖➖➖➖➖➖➖➖➖
➡️Colleagues, I know you have a lot of questions about overcoming the cost of the support area.
But I've always said that it's just an area, so there can be errors.
At this point, I expect the upward movement to resume despite the fact that there are some changes in the wave pattern for waves “12345”, where wave “4” has gone a bit further than expected.
If the price updates the local low of 3925 - the forecast will be canceled or revised.
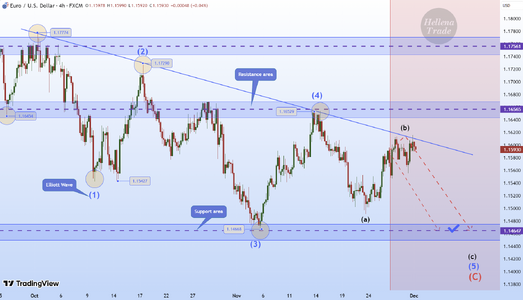
  • Similar to you I see the EURUSD pair coming lower between 1.15296 - 1.14981 region where there is a fairvalue gap which I have highlighted in the chart. The initial move lower (highlighted with the blue arrow) was also accompanied with above average volume.
  • Gold created what looks like a hammer candlestick on slightly below average volume near previous resistance now turned into support and within a fair value gap support zone. Under normal situation the hammer formation around support after a brief down trend might indicate a potential reversal signal. However, one needs to bear in mind that this has occured on slightly below average volume. The slightly lower than average volume suggests less conviction behind the buyer's pushback, making the potential reversal less certain on its own.
  • For the S&P500 I see it still as bullish until we hit the 7400 region where we have an equality move from the previous significant drop. I have attached a chart that I created on 29th July 2025 and believe that it still remains valid.
  • I have attached relevant charts with this reply and would really welcome your thoughts on the analysis.
  • Also, great work with your analysis! I think you do a wonderful job. Keep it up!

EURUSD_2025-11-19_07-26-21.png


XAUUSD_2025-11-18_21-54-26.png


S&P500.jpg
 
#GBPUSD
🔔(UPDATE)GBP/USD (4H): SHORT to min wave "4" area 1.30100.
➖➖➖➖➖➖➖➖➖
➡️I recommend to set trade to breakeven.
(Breakeven=Risk Free: Move Stop loss to the entry level).

#SPX500
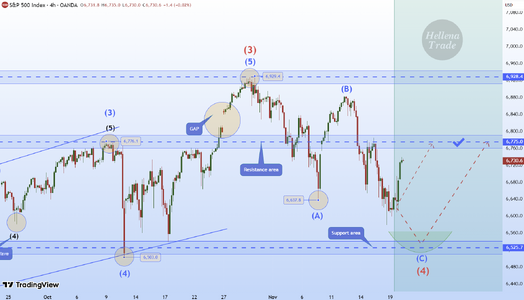
🔔(UPDATE)5️⃣ SPX500 (4H): LONG to resistance area of 6775.
➖➖➖➖➖➖➖➖➖
➡️The price actively seeks the target area, which means the completion of the correction in wave “4”.
I recommend to set trade to breakeven.
(Breakeven=Risk Free: Move Stop loss to the entry level).

#EURUSD
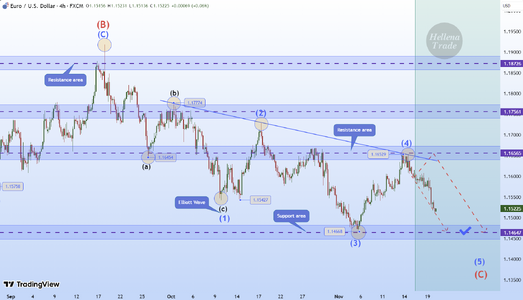
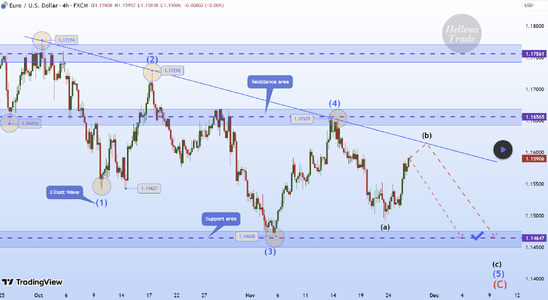
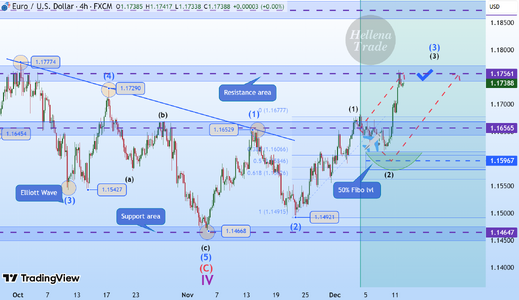
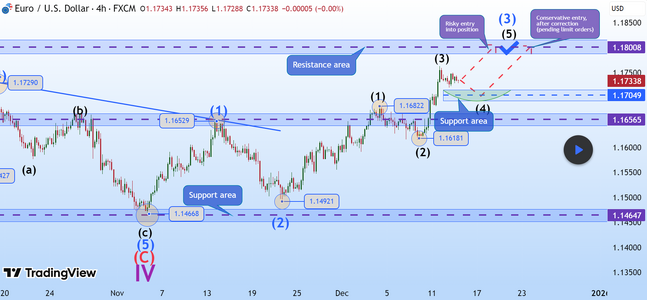
🔔(UPDATE)EUR/USD (4H): SHORT to the support area 1.14647.
➖➖➖➖➖➖➖➖➖
➡️Price has overcome most of the points towards the target. I think we will soon see a small correction where we can profitably enter the position again.
⚡️I recommend to set trade to breakeven.
(Breakeven=Risk Free: Move Stop loss to the entry level).
 

Attachments

  • 2025-11-20_09-29-15.png
    2025-11-20_09-29-15.png
    173.7 KB · Views: 2
  • 2025-11-20_09-20-42.png
    2025-11-20_09-20-42.png
    172.9 KB · Views: 2
  • 2025-11-20_09-18-31.png
    2025-11-20_09-18-31.png
    180.3 KB · Views: 1
  • Similar to you I see the EURUSD pair coming lower between 1.15296 - 1.14981 region where there is a fairvalue gap which I have highlighted in the chart. The initial move lower (highlighted with the blue arrow) was also accompanied with above average volume.
  • Gold created what looks like a hammer candlestick on slightly below average volume near previous resistance now turned into support and within a fair value gap support zone. Under normal situation the hammer formation around support after a brief down trend might indicate a potential reversal signal. However, one needs to bear in mind that this has occured on slightly below average volume. The slightly lower than average volume suggests less conviction behind the buyer's pushback, making the potential reversal less certain on its own.
  • For the S&P500 I see it still as bullish until we hit the 7400 region where we have an equality move from the previous significant drop. I have attached a chart that I created on 29th July 2025 and believe that it still remains valid.
  • I have attached relevant charts with this reply and would really welcome your thoughts on the analysis.
  • Also, great work with your analysis! I think you do a wonderful job. Keep it up!

View attachment 344629

View attachment 344630


View attachment 344631
Thank you very much for your appreciation of my work) Well, apparently our thoughts are similar, so I do not know what else to write about your predictions. I think it's great.)
 
Back
Top