Hellena Trade
Well-known member
- Messages
- 272
- Likes
- 48
#GOLD
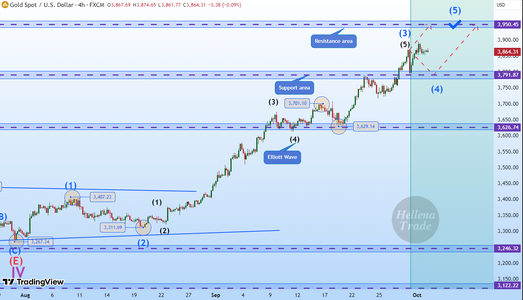
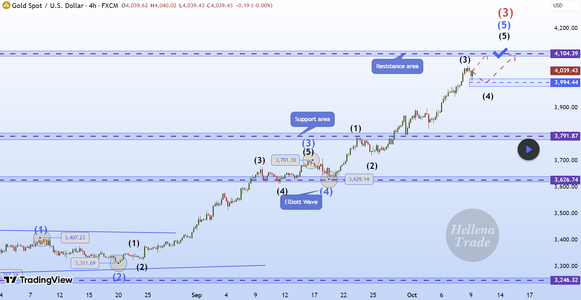
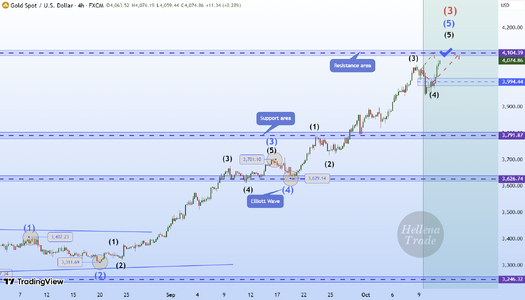
🔔(UPDATE)🥇 GOLD (4H): LONG to support area of 3950.
➖➖➖➖➖➖➖➖➖
➡️The recent confident bounce from the support area is quite telling in terms of the bulls' mood to renew the local highs again.
I think that wave “5” is developing, completing the impulse. After updating the level of 3895.22, I will advise that trades should be set trades to breakeven.
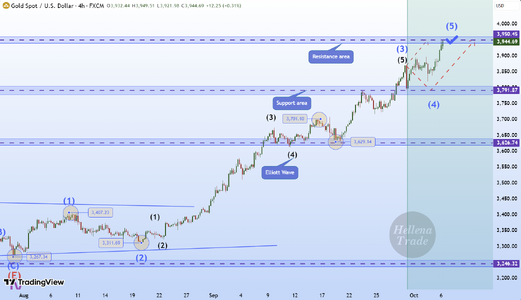
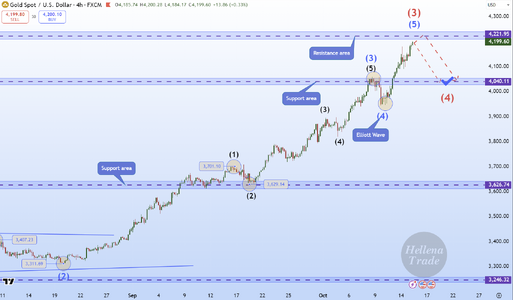