You are using an out of date browser. It may not display this or other websites correctly.
You should upgrade or use an alternative browser.
You should upgrade or use an alternative browser.
dc2000
Veteren member
- Messages
- 4,766
- Likes
- 129
looks like - this week anyway - that the "kick" happening during the more usual times of between 6am-10am, after a number of moves during the asian hours.
I am more and more finding that the best move is a sessional move, whether it be euro or US, and you are better off switching off if you havent traded by 10am, and wait till 2pm, and similarly if not by 4pm, wait till 7-9pm on the US indices.
this certainly removes some of the tedium, and the interminable limbo hours.
views?
EDIT: also, my FDD MT-4 chart show a data gap between 4-am and 6-30am. anyone else?
I do break each session down to work out targets I use Asian 0000-0900 EU/UK 0700-1330 US 1330-2100 these are for daytrading generaly if a move is not exhausted in any one session then a pullback is expected early into the next session before continuing
bbmac
Veteren member
- Messages
- 3,584
- Likes
- 789
trendie
Legendary member
- Messages
- 6,875
- Likes
- 1,433
dont know about you guys but im looking for it to go to 306 before I start to buy it, cant see BOE giving any chrimbo presies when they dont need to
hhhhooooorrraaayyyyy!! welcome back, DC. :cheesy:
trendie
Legendary member
- Messages
- 6,875
- Likes
- 1,433
this is where I get confused about sup/res.
I am not counting DC2000s 306 as he is clearly "making" the market go there, knowing his track record. 🙂
I would have thought a bounce up from here, SUP, before any further down move, if any, so the "channel break" bit I dont understand.
it is also the reason why I stick to MAs. I just dont get the "break". to me, its an up bounce. 😕
EDIT: the above is my take if I were using sup/res, I would expect a bounce off SUP. I am not trading using it, so its academic, but I still want to be able to learn to read it correctly.
Attachments
bbmac
Veteren member
- Messages
- 3,584
- Likes
- 789
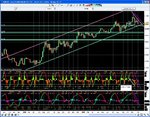
trendie, I think the clue was the channel top rejection again and the lower highs and lower lows on 4hr since that recovery at 0832 area. Also when the 4hr congestion area 0242-0496 broke up to 1162 it slipped back in that channel finding support buying up to a lower high at 0832 area.
This break of support no doubt helped by reaction to that massive ADP # for friday's NFP of +189k against +50k forecasts
This break of support no doubt helped by reaction to that massive ADP # for friday's NFP of +189k against +50k forecasts
trendie
Legendary member
- Messages
- 6,875
- Likes
- 1,433
trendie, I think the clue was the channel top rejection again and the lower highs and lower lows on 4hr since that recovery at 0832 area. Also when the 4hr congestion area 0242-0496 broke up to 1162 it slipped back in that channel finding support buying up to a lower high at 0832 area.
This break of support no doubt helped by reaction to that massive ADP # for friday's NFP of +189k against +50k forecasts
thanks for explanation, and your limitless patience with me.
bbmac
Veteren member
- Messages
- 3,584
- Likes
- 789
trendie, lol, np.
Intraday, the clue was tprobably the triple rejection of the 0397-0418 potential SBR area on the 5min (intermediate) but undoubtedly the ADP jobs forecasts reaction helped to break 0350 area support.
MNi saying bids stronger on approach to 0300 than at 0320/25, Dly S4 is at 0319, and we are 263pis off the intraday highs now.
fibonelli
Experienced member
- Messages
- 1,338
- Likes
- 288
My view is that there needs to be a close below the minor swing low of 20247 which is within the current RBS zone of circa 20247-20260 for the bear case.
There is also pattern failure on a trend re-entry signal (minor sequential low basis). see light blue lines.
I don't like the look of the low close doji (pinbar?) at the peak of the last upmove and the subsequent low close dojis and red candles. Looks suspiciously like a reversal to me rather than a retracement. Momentum is v bearish (see purple lines). A close (nicely) below 20247 will confirm this observation.
Attachments
dc2000
Veteren member
- Messages
- 4,766
- Likes
- 129
hhhhooooorrraaayyyyy!! welcome back, DC. :cheesy:
cheers trendie
graemenash
Active member
- Messages
- 144
- Likes
- 18
Dentalfloss
Legendary member
- Messages
- 63,404
- Likes
- 3,726
why did u give up day trading
Your Chart Post #53
You can't see the woods for the trees
You are looking too hard to find the answer.
! POST #53
You can't see the woods for the trees
You are looking too hard to find the answer.
fibonelli
Experienced member
- Messages
- 1,338
- Likes
- 288
You can't see the woods for the trees
You are looking too hard to find the answer.
I gave up looking at the 15m charts for the same reason. i was often 😕 😕
30m charts is much better, lol
graemenash
Active member
- Messages
- 144
- Likes
- 18
why did u give up day trading
Health and quality of life. 4 years of full-time daytrading has left me with constant neck/back pain and severe eyestrain/dizziness, plus a gradually expanding waistline, I'm only 26 but I feel like I'm about 96 🙁 Spending 8 hours a day watching for setups has also left me with none of the freedom that attracted me to trading in the first place.
On top of that I believe my trading method is better-suited to longer-timeframe trading. It produces relatively few signals per chart it is traded on, so to make it viable for day-trading I've been trading it on 8 pairs across 2 timeframes, i.e 16 charts, with the inevitable result being mistakes and missed trades which have meant I've not been trading my system to it's full potential. I believe this is less likely to happen if I have hours to analyze and prepare for a trade rather than minutes.
I gave up looking at the 15m charts for the same reason. i was often 😕 😕
30m charts is much better, lol
I was on about his psychedelic swirly lines on his chart.
graemenash
Active member
- Messages
- 144
- Likes
- 18
I was on about his psychedelic swirly lines on his chart.
They might not work for you, but they do me just fine :cheesy:
They might not work for you, but they do me just fine :cheesy:
You are correct, as long as it works for you.
Good trading
LT