You are using an out of date browser. It may not display this or other websites correctly.
You should upgrade or use an alternative browser.
You should upgrade or use an alternative browser.
hmm, fast developments..
bbmac, with the new lower high (in respect to the morning one at 670) on 15min chart at around 655, would you consider this to be a deep pullback of a down move ?
le : or depends if the 630-590 zone will act as support to the correction from 655...?
bbmac, with the new lower high (in respect to the morning one at 670) on 15min chart at around 655, would you consider this to be a deep pullback of a down move ?
le : or depends if the 630-590 zone will act as support to the correction from 655...?
bbmac
Veteren member
- Messages
- 3,584
- Likes
- 789
It certainly began to look that way, ie a deeper pullback, falling short of the current daily high around 0672,. For me, the last 2 lower swing highs in the downtrend on my 5min intermediate chart were exceeded on the way up (0623 and 0652 area) resulting in an uptrend at the highs on the intermediate chart, the longer/trend time frame was ranging now....so a mixed picture really up to 30min, intraday.
There was however clear hidden/reverse divergence in the 15min osma and a clear reversal set-up in the 1min trigger (Reversal extreme)
There was however clear hidden/reverse divergence in the 15min osma and a clear reversal set-up in the 1min trigger (Reversal extreme)
thnx for the explanation bbmac. it seems to be resuming the up trend on 5min.
the falling short part, i think, was caused by sharp up move in eur/gbp following the news release. but since eddie and cable work "in tandem", usually, in this kind of situation, whenever eur/gbp begins to stall, cable goes same direction as eur/usd.
the falling short part, i think, was caused by sharp up move in eur/gbp following the news release. but since eddie and cable work "in tandem", usually, in this kind of situation, whenever eur/gbp begins to stall, cable goes same direction as eur/usd.
bbmac
Veteren member
- Messages
- 3,584
- Likes
- 789
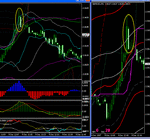
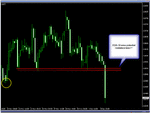
The 1min Reversal Extreme is posted here (see screenshot), there was asimilar breech of fib tunnels and donchian channels on the 5min too (not shown here.)
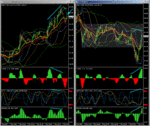
15min osma showed the hidden divergence but only that oscillator. (see 2nd screenshot)...I was looking for hidden see-saw divergence at the lower high but didnt see any.
15min osma showed the hidden divergence but only that oscillator. (see 2nd screenshot)...I was looking for hidden see-saw divergence at the lower high but didnt see any.
Attachments
bbmac
Veteren member
- Messages
- 3,584
- Likes
- 789
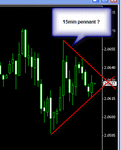
and look where the support was in the resumed uptrend...the first 5min intermediate potential RBS zone of the uptrend, point A being the broken higher swing high (than the last lower swing high of downtrend), point B being the higher swing low.
Bit messy still though, now on the smaller intraday time fraames.
Bit messy still though, now on the smaller intraday time fraames.
Attachments
...
Bit messy still though, now on the smaller intraday time fraames.
effects of market incertitude 🙂
due the the fast moves, I didn't exit my trade when it camed down to 610 and waited to book some profits when it hit the 650 again. that was only in respect to the eur/usd, eur/gbp and cable above judgement. otherwise, it would've been a b/e trade.
graemenash
Active member
- Messages
- 144
- Likes
- 18
bbmac
Veteren member
- Messages
- 3,584
- Likes
- 789
Gl with that EJ short GN.
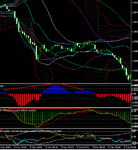
Messy 4hr chop of late in cable, see screenshot. Subdued today so far 86pips hi-lo, yesterday 155, .....178 175 185 being the 5 10 and 20 day pip range averages respectively.
This week so far 334, last week's 298 falling below the 375, 327 and 337 5 , 10 and 20 week averages respectively.
Messy 4hr chop of late in cable, see screenshot. Subdued today so far 86pips hi-lo, yesterday 155, .....178 175 185 being the 5 10 and 20 day pip range averages respectively.
This week so far 334, last week's 298 falling below the 375, 327 and 337 5 , 10 and 20 week averages respectively.
Attachments
graemenash
Active member
- Messages
- 144
- Likes
- 18
Those xxxxxx 1/2pips on saxo, lol
Yeah... on that trade I even put the limit half a pip up from where it should have been 😈
trendie
Legendary member
- Messages
- 6,875
- Likes
- 1,433
looks like - this week anyway - that the "kick" happening during the more usual times of between 6am-10am, after a number of moves during the asian hours.
I am more and more finding that the best move is a sessional move, whether it be euro or US, and you are better off switching off if you havent traded by 10am, and wait till 2pm, and similarly if not by 4pm, wait till 7-9pm on the US indices.
this certainly removes some of the tedium, and the interminable limbo hours.
views?
EDIT: also, my FDD MT-4 chart show a data gap between 4-am and 6-30am. anyone else?
bbmac
Veteren member
- Messages
- 3,584
- Likes
- 789
bbmac
Veteren member
- Messages
- 3,584
- Likes
- 789
bbmac
Veteren member
- Messages
- 3,584
- Likes
- 789
Prior to the above and price is retracing to former bids areas not maing the last potential SBR areas on the intermediate 5min. The screencap shows the set-up at the 0480area.
The last 5min SBR area is 0397-0418 tested an held at the re-entry mentione above, Above here and 0453-0485 becomes the last but one 5min and coexisting with the last 15min potential SBR zone.
Support here at Novembers lows areas around 0350, all stocchs extreme o/s to 4hrs when at that level
1min trigger Reentry type 2
Attachments
bbmac
Veteren member
- Messages
- 3,584
- Likes
- 789
That 0520-30 area looks like potential resistance now on 4hr x 4 hits as support, below this and the yellow cirled area 0453 also coincides with the last but one 5min and last 15min potential SBR zone of the intraday move.
MNi saying offers still at 0400-10, ahead of 0450, 0480/85 areas likely.
4hr chart shown.
MNi saying offers still at 0400-10, ahead of 0450, 0480/85 areas likely.
4hr chart shown.
Attachments
bbmac
Veteren member
- Messages
- 3,584
- Likes
- 789
Kenny & Dolly...Islands in the stream, on Magic atm, a modern classic, lol...I don't know any other station that gets awaty with playing this and the carpenters.
Passion Radio ® - Number One for Dance in Sussex - on DAB Digital Radio and FM also a great listen, the old Atlantic252 guys
Passion Radio ® - Number One for Dance in Sussex - on DAB Digital Radio and FM also a great listen, the old Atlantic252 guys
bbmac
Veteren member
- Messages
- 3,584
- Likes
- 789
The higher low in both 5 and 15min time frames putts me off, but got another set-up at that 0400/10 area to short....and as an area is often re-tested it's worth a punt, particularly as it falls in the last 5min SBR zone 0397-0418 and a 3 fib cluster there inc the 23.6% of the intraday move, as well as offers confirmed by MNi.
1min trigger Reversal A (ii) with 5min Reentry 4.
1min trigger Reversal A (ii) with 5min Reentry 4.

