FTSE 100 - March

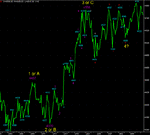
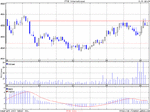
mmm, while I was soaking up some sun got to wondering if
volume per point might tell us anything.

eg: a strong up day on lowish volume (hence low volume per
point) would mean relatively few sellers and be bullish?

conversely, a similar day on high volume (hence high volume per
point) would mean there were a lot of sellers about and might be
a touch bearish?

that's a bit simplistic but you get the drift.
 
sounds logical to me. but you would have to make sure the volume is accurate?
 
i'll give it a bit of work then.

doesn't seem much enthusiasm to move into negative territory
so far.
 
FTSE100 chart

Hi everyone.
Been abroad for the last few days.
Thread appears to have gone silent since Bonsai's family problem.
Anyway, here is something to chew over.

Any thoughts on the chart?
What about the wave count etc?
 

Attachments

  • chart.gif
    chart.gif
    16.2 KB · Views: 275
Mully,

Got the same. One alternative could be that this rising wedge is an ending triangle of a double 3.....Wave A being a flat and wave B being a zig-zag??
 
Thought I'd see how the candles got on while I was away.

Maybe the most notable feature has been the continued support
given by the long candlesticks (intial support at mid-point and
primary support at extreme)
 

Attachments

  • ftsem.gif
    ftsem.gif
    10.9 KB · Views: 279
......and the long candle of today was a down one - it seems to
have given resistance
 

Attachments

  • dftse.gif
    dftse.gif
    17 KB · Views: 260
Mully,

With the rising wedge on the S&P been broken on the downside, i feeling more convinced that the triangle that has been forming over the last week or so is the end of larger zig-zag wave B.

If/when 4,525 is broken 2morow, next stop will be 4,500 and then 4,480....imho
 
FTSE still in a wedge that looks corrective imo.even if we break the bottom line I wont be convinced until we see a move down and away from 4500
 
today youve got a great price 20 poinst above futures . CAnt get better thanthat :) LOL but seriously Im thinking about market price. Today the open it too close to trendline support for me to go with the open but no long signals yet so sitting and waiting.
 
On Volume:
in the last few days, we had lower volume on up days and higher volume on down days. Doesn't that signifies that the bulls are slowly losing grip and the bears are getting stronger?
 
Hi Trading Shed,

Noticed the same thing and seems logical, but who said this market is logical???? Saying that i have felt safer going on the short side, but there is strong support at the bottom of the wedge line.

Hooya,

Wouldn't the open at close to the trendline not be the ideal time to go long and keep a very tight stop??
 
ts & fin

Not so sure about that. The down moves were relatively low so
the bulls mostly absorbed the increased selling pressure? Then
the following up moves were bigger on lower volume maybe
indicating that the bears had retreated and the bulls needed to
bid up to get their stock? Of course the increased selling pressure
may have come from "professional" bears taking their money from
a lot of "amateur" bulls while the going's good!!!!!
 
Top