You are using an out of date browser. It may not display this or other websites correctly.
You should upgrade or use an alternative browser.
You should upgrade or use an alternative browser.
- Status
- Not open for further replies.

I trade mainly dax but my longer term view is all about the S&P
Looking at a daily chart I felt that we were out of the woods once the mkt bounced off the 775 area for the third time in March, this level had been tested in July 2002 and again in Oct 2002, and when we moved above 965 in June this was confirmation. We've been back to test 965 twice subsequently and bounced off very nicely.
I dont know how high we have to go before this can be called a bull market, but a bear market ?
Bonsai...during the quiet periods over the last few sessions and a few before my Hols I have been analysing daily data to see if there is any possible way of telling if the next day will be up or down. I know search fro the holy grail is futile but it keeps the mind active and besides if one was ever to find something that looks good on paper...then I guess you could sell it to un suspecting traders.
Well Out of a sample of 63 days I have found a signal that suggested either higher or lower close on 60 out of the 63 days and wait for it......and the results show that the signal is 81% correct.!!!! however this is based on Yahoo OHLC but still looks quite interested. Not sure how you could trade it with stops etc.. WIll keep you informed
Well Out of a sample of 63 days I have found a signal that suggested either higher or lower close on 60 out of the 63 days and wait for it......and the results show that the signal is 81% correct.!!!! however this is based on Yahoo OHLC but still looks quite interested. Not sure how you could trade it with stops etc.. WIll keep you informed
Last edited:
hungrybear
Active member
- Messages
- 209
- Likes
- 0
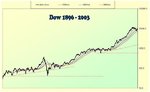
the bear market is only over if the Dow breaks 10666 and/or the Ftse breaks 5408.
You would think that 81% strke rate would produce a few points. well if one entered a trade at close of day and only closed it at end of the next day system would only produce 345 points i.e 5 points a day over the test period. Best case senario is 24 points per day average and worst case is -26 per day? Now to put that into a system of enty and exit?LOL
edit: I guess the first thing to do would be to see how a stop loss of 26 points (based on the ave worst case) would effect the profits?
edit 2:- got the formula wrong for worst case it should be -22 average
edit: I guess the first thing to do would be to see how a stop loss of 26 points (based on the ave worst case) would effect the profits?
edit 2:- got the formula wrong for worst case it should be -22 average
Last edited:
hungrybear said:the bear market is only over if the Dow breaks 10666 and/or the Ftse breaks 5408.
I'd be interested to know why this is the case and what is the equivalent level on the S&P
hungrybear
Active member
- Messages
- 209
- Likes
- 0
S&P is 1177. I cant divulge why this is the case, though a slight correction to what I said is that the bear market will be confirmed as being over if these levels are exceeded- of course it will have been over since the low point that was previously recorded.
IMO this is a bear correction, and is unlikely to be over until the US presidential election is over next year. Theey wont allow the markets to fall until then, unless there is a major disaster.
IMO this is a bear correction, and is unlikely to be over until the US presidential election is over next year. Theey wont allow the markets to fall until then, unless there is a major disaster.
bonsai,
on S&P the 775 level was tested for the first time in july 2002 and finally in march 2003................eight months later.
It's now 16 months since july 2002 ..............you can hardly describe that as turning on a sixpence
hungrybear, You say that you are unable to divulge why this is the case. Is it a secret ?
hungrybear
Active member
- Messages
- 209
- Likes
- 0
qaza,
It's a subscription society who take legal action against anyone found divulging key info. I don't think stating prices should be a problem though. Besides, I don't think the issue of bear or bull market will have much influence on anyone day trading, or even swing trading!
It's a subscription society who take legal action against anyone found divulging key info. I don't think stating prices should be a problem though. Besides, I don't think the issue of bear or bull market will have much influence on anyone day trading, or even swing trading!
- Status
- Not open for further replies.
Similar threads
- Replies
- 478
- Views
- 75K
- Replies
- 2
- Views
- 4K