FTSE 100 Intraday - November

Status
Not open for further replies.
hope to be back in the fold tomorrow if my wife will unweld
the paintbrush from my hand.

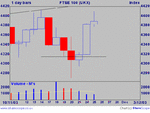
In the meantime the action over the last three days has resulted
in a classic stalled pattern of candlesticks. Re-inforced by the
relatively low volume and todays shooting star type candle. (all
allowing for s/scopes non-recognition of gap openings, of course)

Candlestick theory says that the markets rally should stall at the
emergence of the stalled pattern. We shall see.

good trading

jon
 

Attachments

  • ftse25.gif
    ftse25.gif
    11.3 KB · Views: 416
Last edited:
looks like I timed my exit ok
at the close dow looks to have stalled as well

ho hum

ftse now 89/93
 
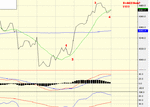
is this a possibility wavers?
 

Attachments

  • screenshot006.gif
    screenshot006.gif
    13.6 KB · Views: 399
mutterings on cnbc about it being time to switch from 250 to 100.

looking at the 100 chart, seems an odd time to fly that kite ?
 
unfortunately, there is AMV !
should be doing better.
just hope(?) their performance is down to possible litigation.
 
mornin' all

some advise not to trade ftse (or shares) in December after
the first week because of erratic movements as institutions
and fund managers balance their books for the year end. My
own P&L records (shares only) over the last few years would
tend to support this, but it's only a very small sample.

what's your experience as far as ftse is concerned?

jon
 
I have to eat in December just like any other month.

so you put 'em up
and I'll knock 'em down

lol

(expiry is always a dodgy day)
 
I think I have to go with Bonsai on that one...here to trade whatever teh conditions I guess.
If you start to knock out the dodgy trading weeks
in the year...you would end up with very few to trade:)imo
 
my 33 looking more likely now, new high, dax 20 points off filling it's gap
 
pure speculation
but you know how the germans dislike being second in anything.

it looks distinctly possible they may not make a new high ?
so if the dax fails and then breaks down, it might just become
a leading indicator.

I know the mix is different but ........

however, if it makes a new high then forget it.
 
Barjon:
"October. This is one of the peculiarly dangerous months to speculate in stocks in. The others are July, January, September, April, November, May, March, June, December, August, and February." Mark Twain.

Bonsai: I am away in the country enjoying my hobby rushing over the countryside. When i return, hopefully in one piece if very muddy, i will reply in full.
 
mully :LOL: :LOL:

don't get too muddy

gotta go for an hour or so - son panicking about water coming
in and threatening to bring down his kitchen ceiling. Hope there's
no short signal while I'm away.
 
it seems that the major long term overhead resistance
is at 4462 from last year.
But that was an eod type figure.
Unfortunately, in my folly, I deleted the intra day chart
some time ago. so I guess we could hit effective resistance
anywhere now as we are within the daily range of 4462.

here is the high/low/close
"19-Aug M 4380 4293 4330"
"20-Aug T 4427 4308 4427"
"21-Aug W 4451 4362 4369"
"22-Aug TH 4465 4350 4365"
"23-Aug F 4436 4390 4435"
"26-Aug M 4449 4390 4390"
"27-Aug T 4462 4362 4450"
"28-Aug W 4414 4274 4274"
"29-Aug TH 4265 4182 4209"
 
dont want to get your hopes up but...i think there might be a gap to fill from last year LOL just trying to get the chart up
 
Status
Not open for further replies.
Top