You are using an out of date browser. It may not display this or other websites correctly.
You should upgrade or use an alternative browser.
You should upgrade or use an alternative browser.
- Status
- Not open for further replies.
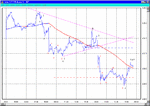
lol it been put back as a gap???? dangerous indeed...it go me out of my short for +13 so shouldnt complain
<img src='http://lc-d.sc8.finance.lycos.com:443/1069349770808?User=demo&Pswd=demo&DataType=GIF&Symbol=INDEX:SPX.X&Interval=1&Ht=400&Wd=600&Display=2&Study=&Param1=&Param2=&Param3=&FontSize=10&BgColor=0.255.0&TBgColor=0.255.0'>
<img src='http://lc-d.sc8.finance.lycos.com:443/1069349770808?User=demo&Pswd=demo&DataType=GIF&Symbol=INDEX:SPX.X&Interval=1&Ht=400&Wd=600&Display=2&Study=&Param1=&Param2=&Param3=&FontSize=10&BgColor=0.255.0&TBgColor=0.255.0'>
Attachments
looks like I was right on the dow.
it seems to have made some sort of low at the close
but the wave count seems messy. So although its down
since ftse close, cant get any convincing idea of where its going next.
ftse now 94/98 seems to cover it but puts ftse in no mans land.
it seems to have made some sort of low at the close
but the wave count seems messy. So although its down
since ftse close, cant get any convincing idea of where its going next.
ftse now 94/98 seems to cover it but puts ftse in no mans land.
hungrybear
Active member
- Messages
- 209
- Likes
- 0
Bonsai,
I've got a similar wave count to you for the Ftse, except that the drop to a new low early yesterday afternoon looked a bit corrective, so I'm labelling it as wave b of an expanded flat correction. Could be either though and both counts say new lows.
On my swing trading I was originally thinking next Tuesday/Wed would be a high, but it's looking likely to be a low, which would strongly suggest a LT trend change and that the top is in for this year. TWT.
cant really see any reason why the correction would stop there? no MAs, no gap fills, short of resistance and trendlines, not near a pivot point.....slightly overbought on 5 min chart but plenty or room on 10 min chart...but maybe there doesnt have to be a reason
hungrybear
Active member
- Messages
- 209
- Likes
- 0
For a correction with the low at yesterday mornings low (for an expanded flat), the 23% retrace is 4313
Just to add to the discussion, now that I have safely dispatched my children off to school/swimming, if FTSE is in wave 4 then upside is capped by low of wave 1 which was recorded on the 19/11 at 4316.
PS: That would appear to also meet the trendline off the highs from the Market top.
PS: That would appear to also meet the trendline off the highs from the Market top.
- Status
- Not open for further replies.
Similar threads
- Replies
- 478
- Views
- 70K
- Replies
- 2
- Views
- 3K


