You are using an out of date browser. It may not display this or other websites correctly.
You should upgrade or use an alternative browser.
You should upgrade or use an alternative browser.
- Status
- Not open for further replies.
aha ! yes 510/5, gotya.
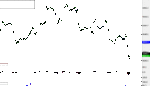
can't tell for sure but that looks like a line chart ?
so they wouldnt show ?
didnt notice your triple bottom. I only chart it for 3 days.
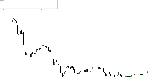
not sure what it might really mean.
what I do see is the repeat failure to stay above zero which
surely is a clue to the state of the market. (and direction)
can't tell for sure but that looks like a line chart ?
so they wouldnt show ?
didnt notice your triple bottom. I only chart it for 3 days.
not sure what it might really mean.
what I do see is the repeat failure to stay above zero which
surely is a clue to the state of the market. (and direction)
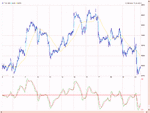
I thought i would add some perspective. Using a 10 min chart, and equivalent MA of 6 and 51, it appears that -30odd on the MACD appears to offer buys and, as Bonsai has pointed out, the MACD peaks have recently found problems over-coming the zero line. I presume we are trying to work back to the zero line.... and then it gets interesting again.
Also, in hindsight, note the clear divergence with price and the MACD at the market peak last week.
Also, in hindsight, note the clear divergence with price and the MACD at the market peak last week.
Attachments
lol
if I wait long enough it will make a new low and then I can answer NO.
the only answer I can really give is
'that is not my wave count'
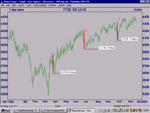
after a new high at 4411, I can think of no reason why it may not want to test its bottom trend line at 4230 ish.
I can't find a count that says we have had a 5th of the 5th of C.
if I wait long enough it will make a new low and then I can answer NO.
the only answer I can really give is
'that is not my wave count'
after a new high at 4411, I can think of no reason why it may not want to test its bottom trend line at 4230 ish.
I can't find a count that says we have had a 5th of the 5th of C.
Just to play the devil's advocate, couldn't the move from todays low be wave A, the drop since 12.00pm wave B with wave c to come.
Just an alternative.
I am paying attention to the time span of the previous rally that started yesterday and ended abruptly at 9.00am to-day. In otherwords, this current rally appears much, much shorter in time.
Just an alternative.
I am paying attention to the time span of the previous rally that started yesterday and ended abruptly at 9.00am to-day. In otherwords, this current rally appears much, much shorter in time.
Last edited:
barjon
Legendary member
- Messages
- 10,752
- Likes
- 1,863
- Status
- Not open for further replies.
Similar threads
- Replies
- 478
- Views
- 74K
- Replies
- 2
- Views
- 4K