FTSE 100 - April

Status
Not open for further replies.
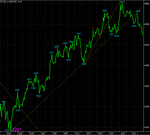
Just to explain the last chart a little - the pink histogram as the bottom of the chart is a collection of fib time projections from the low of the 24th March.

I know the wave counts are wrong, am having a little trouble with the FTSE 100 at the meoment.
 
here's my 10 min chart again......equal waves so far but tomorrow will be the test imo. Big data in the US.

Not sure of the count so just labelled it abc at the mo?
 

Attachments

  • ftseday.gif
    ftseday.gif
    49.3 KB · Views: 278
Davros , thanks for that.
that's the way I was reading it too
-lorra lorra support with last correction
but timing is everything in this game and it looks like I mayhave jumped the gun
but still expect upward momentum to come

perhaps they are trying to take out as many stops as possible before the dow surges again ?
not that that is a problem for us 1day sma traders , just be prepared.

edit
Hooya
your working wave count looks fine to me
PM for you
 
Last edited:
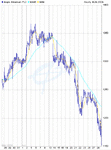
Interesting how Tuesday's late rally tried to climb back to the breakline started 0n 24/03/2004. It failed and led to quick sell off.

Currently FTSE 100 at previous low of 4524. Would not be good news if it breaks.
 

Attachments

  • chart.gif
    chart.gif
    17.6 KB · Views: 207
Mully.

Your charts look as though they are printed in a portrait mode, I always thought charts should be in landscape to get the trend lines at the correct angle etc. Are they more accurate in portrait.
Hope you dont mind me asking the question.
 
Fluke

The effect of cropping original pictures!

I use the 'rectangle' function in Printkey 2000
to crop my Superchart charts to please Bonsai.
However, to-days post will probably annoy him
as it is rather large for his screen.
 
Right the wave is extending in to oversold conditions on my charts althoug 60 min has a bit more to go if need be. Currently the "c" wave is 1.618*a at 500 so looking for support if not more downside to come.
 

Attachments

  • sdsasd.gif
    sdsasd.gif
    36.8 KB · Views: 218
Mully
Thanks for clearing that up for me,I like to be as accurate as I can and be able to follow other traders methods.
Bye the way, I like the above chart.
 
Chinese trying to cool their economy

You can put the blame on the Chinese authorities putting the break on their growth rate by stopping bank lending. Just look at the impact on Mining stocks to explain some of the weakness in the FTSE100
 

Attachments

  • chart.gif
    chart.gif
    20 KB · Views: 270
mully
your charts are justfine

by the way -classic sell signals ? - yesterday at 11.30
failed at 1 day and macd failed to break zero
 
a bit of cycle for us to think about. Finishes at about 2
 

Attachments

  • untitled.gif
    untitled.gif
    55.1 KB · Views: 255
5 of 5 of c complete now??

or should I have said nearly complete now LOL
 
Last edited:
seems to be following through the approx 2pm cycle line too...interesting stuff
 
hmmm

this thread seems to be dying away ......... ?
too few contributors, too many voyeurs

well, its been a year and I think that's long enough.
so I will be giving it a miss from the end of this month.

maybe someone else would like to pick it up and run with it ?
 
I have been thinking along the same lines.
Very few are actually posting, yet viewings remain very strong.
It is about time others gave a little to justify the thread.
It takes the few of us time/effort to post.

What thoughts are posted attract very little comment (outside the very few die-hards-Bonsai, Hooya, Fluke etc).

I get very little out of this thread (with the obvious exceptions).

Couldn't the diehards have their own thread?
 
Come join me, Lee, the Dickster, Wolf, DKIA, Lex and a few other s on ADVFN if you like. it cost's though!
 
Last edited:
Bonsai.
I am sorry to see that you are going to end you thread,I have learnt so much from you over the months.in fact you have been a real inspiration to me.I have just recently managed to reduce my loosing trades and increase my winners.I have found you very helpful and patient when replying to my questions.
I wish you all the very best and remember to keep out of the horse Road.

Kind regards Jon
 
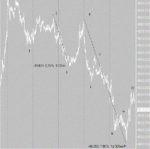
Alternative wave count...... Could still be in a wave 5 of a zig-zag (5-3-5) correction??

wave V/wave 3 target at 38% fib of the move up from 4,290.
 

Attachments

  • untitled.gif
    untitled.gif
    106.3 KB · Views: 204
Status
Not open for further replies.
Top