FTSE 100 - April

Status
Not open for further replies.

bonsai

Veteren member
Messages
4,106
Likes
11
One down, three to go ?
Not the most scintillating of quarters, wouldn't you say.
started at 4476 and ended at 4398

Never mind, spring is in the air and the trout season is getting under way !! so some of us have something to be cheerful about.

The current fall started when Ftse failed to cling on to the bottom channel line.
So any rally now is likely to find that line providing resistance.

I have suggested this might be the start of the 'B' wave down but we could do with a failed retest of the high to confirm the high is in for some time.

65 day average is at 4450 and falling.

There is a support line from 3600 last year which runs under the lows , particularly 4082 and 4295. I haven't drawn it on the chart but you might like to.
(it may be nothing, but you never know ?)
 

Attachments

  • mar04.gif
    mar04.gif
    9.5 KB · Views: 1,010
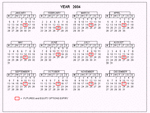
looking atthe calendar I posted earlier in the year, the August expiry date needs changing.

so here is revised version.
 

Attachments

  • 2004a.gif
    2004a.gif
    41.1 KB · Views: 983
now I have dusted it off, I might as well use it I suppose.

so here is the chart again.
 

Attachments

  • kase.gif
    kase.gif
    49.7 KB · Views: 972
been hard to get on t2w today. A retest seems unlikely to me but as you say possible. Think tomorrow could mark a high. The fib at 29 looks a tough cookie to crack imo. US looks tired to me so once the data is out of the way tomorrow......it can raom freely. Hopefully it will push up into the close so the FTSE spikes in the morning.


Thanks for the calendar update. no other news. Just looking forward to normal trading hours next week
 
odd sort of trading day

it wasnt so much as 'filling its opening gaps' as
'filling all the gaps' left yesterday afternoon and this morning.

you may have had dificulty making money today unless you were following the wave count and even then not very much.
after the early high, it spent nearly all day making an abc until the reversal signal at about 2.30pm
But that was a higher low on the macd, so not to be sniffed at ?
 
afternoon move was the move of the day like alot of moves this week
 
getting a bit rarefied up here given all the hype ?
and its only 11am.
if we stay up here, I will soon be overbought.
but a flat correction could work it off.

this fib is turning out to be more important than I had thought.
 
my charts are saying teh correction up is over but tobe honest they have been saying that most of the week and the index just falls a bit easing the indicators for another push up but the push never really amounts to anything. Spx look tired after it hit its fib last night but dow as always look bizarre to me. They are expecting 120k non farm payrolls today. be interesting to see if they get it.
 
now what? the top of a channel line is at 80 ish. IS that too much to expect?
 
I've got 4458 as the 38.2 retracement of the recent shenanigans so am targetting that from a short at 4475.
Does that fit in with your calcs?
Splash
 
Bizarre day eh? By the eod FTSE looking stronger than Spx. US V overbought now with divergences again.
 
Bizarre indeed. Leaked figures that have had more impact on European markets than US.
Why Gilts are down a point on the fact that interest rates in the US are likely to increase when we already know ours are on the way up is odd and the renewed vigour in the FTSE seems very over done.
I guess the 4500 level looks tempting and maybe we'll see it on Monday, then again maybe sense will prevail and we'll get back into sensible territory.
Quite happy to be short here at these levels as worse case scenario is probably scratching next week..........brave words but makes me feel better.
What levels are you looking at on the June FTSE?
 
Im trading the cash. We are currently in a nice channel and nearly hit the top line. Theres also the underside of a trendline from september which is around 4500. BUt im noy worried about buy and selling this market at moment.

Bonsai you have a PM
 

Attachments

  • ddsa.gif
    ddsa.gif
    35.7 KB · Views: 670
splasher
I have fib at 4462 (about the same as yours)
so it could be a turning point especially as I am overbought on all cylinders.

but we still have a single staircase up to ~4500 which as you say looks inviting.
and so far this rally has looked sound.

I have not yet seen a reversal signal.
The most obvious would be a failure to hold above the fib ?
 
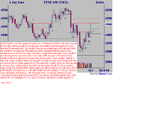
support and resistance - the continuing saga of long candlesticks.

be off piste for a bit - may everything you touch turn to gold.

good trading all.
 

Attachments

  • ftsewe.gif
    ftsewe.gif
    17.6 KB · Views: 377
Last edited:
very interesting barjon

no doubt about it, the mid point of the long candles has produced some interesting chart reactions.
 
mmm, not usual for it all to work quite as well as the last few
weeks tho'. In theory the extreme peaks/bases provide the
stronger resistance/support (interesting how 2,5 & 11 burst
through rather than crept through?) with the mid-points working
for the stronger directional moves.

None the less you wouldn't have gone far wrong over the last few
weeks taking an opening position based on these resistance and
support levels where they have stopped a reasonable move from
the previous day.** If it continues, the favourite on Monday would
be a down move (maybe testing mid-point of 11) but with a
strong upward burst on the cards (maybe even through 495).

That almost guarantees a narrow range day, lol. You'll find
out Monday - I'll be giving it a rest.

edit: ** sorry, it was late so forgot my chart is without opening
gaps, so appearances may be a bit deceptive from a
trading opportunity standpoint. I have used mainly to
inform stops and exits so the comment was NOT based
on experience.
 
Last edited:
FTSE 100 EW pattern

Just trying to get some discussion going on the thread.

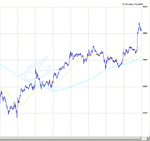
Any thoughts on the possibility that FTSE 100 may be showing a 5 wave pattern from the low on the 24/03/2004, with index currently in the latter stages of wave 5.

Could suggests it is all part of a bigger wave 5?
 

Attachments

  • chart.gif
    chart.gif
    16.2 KB · Views: 308
Status
Not open for further replies.
Top