Dow Intraday charts 27/10 31/10

ChartMan

Legendary member
Messages
5,580
Likes
47
At least I got today's direction right from the last three day's candles.... unlike last week. :cheesy:
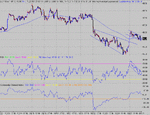
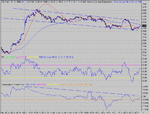
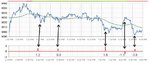
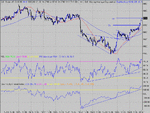
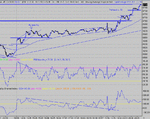
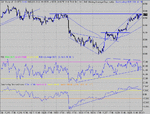
So today broke to the upside,forming a very nice bull flag. RSI ratios look like favouring an up move. This is something I've not really looked at in the past.... The bull flag has 3 peaks and the close has come off the third low. If this is to perform, it has to break tomorrow.....9580 support and 9620 resistance gives a nice tight range for an easy decision. Note horizontal resistance and the bull flag down trend resistance lines are about to meet at 9620.....
The expanding triangle has a target of 9700 and the bull flag's target is 9750/60. Look back at the congestion over the last weeks in that area. Not a good place to be. If we get there, expect whipsaws, unless we fly through or bounce down.
 

Attachments

  • dow 27-10-03 10.gif
    dow 27-10-03 10.gif
    31.5 KB · Views: 878
Nasty day if you were filled with Bull.... Seems the only trade was a short off the divergent top after the first hour... But what to do for the rest of the day? Knitting, perhaps. I shall have to go over the road for some tuition , I think. :cheesy:
I'm looking at an indicator that may assist in taking an opening trade (in red) that I've shown today. I won't show it again until I've done some more work on it. I'm not in favour of spattering charts with graffiti, but if this looks useful, I'll post what it is and how I see it working. Please don't ask what it is . I'd prefer not to be embarrassed if it turns out to be a waste of time. It's really a gentle nudge to say that you should all look at various indicators and see if something "clicks". Take the time to play around when you get a bored moment. I personally find it more interesting than looking at knitting patterns..... Is that a pair of Men's gloves you are knitting over there ?
 

Attachments

  • dow 27-10-03 1.gif
    dow 27-10-03 1.gif
    28.5 KB · Views: 841
I wondered if anyone is interested in this.....

You remember last week there was discussion about RSI and strength of move?

Well I though I'd have a look at that since it is relevant to the Dow strategy. It turns out that it is quite a difficult problem to crack since what is a max or min can be very subjective. I am still working on the answer but along the way I came up with this in Excel.

It actually looks for short term RSI strength/weakness and if the ratio goes above 0.8 over a selected period [It's more complicated than that!] then it will be flagged.

You see today's chart produced 5 indicators and just before crucial resistance or reversal. This is exactly as they came out today, no fiddling with parameteres or anything. The next to last one was interesting since I did not expect a reversal from what looked like a strong up move. 9630 ish.


Heres hoping the attachment comes out ok.......


Don't take it too seriously, I have tested it against other intraday data with mixed results.

PS The other thiing is that it generally precedes the main move, not just today but also in other tests I've done.
 

Attachments

  • rsistrengthresampled.jpg
    rsistrengthresampled.jpg
    49 KB · Views: 834
Now there's a nice continuation of an original idea. I hope you can make something of it. While we're on the subject, I'll remind you of one of the Jems I picked up from Manning:- every stock ( instrument/index) has it's own characteristics. You may be barking up the wrong tree looking for it to work elsewhere in the same way... just a thought.
 
Screen/Chart Size.

I'v been following your postings for a while and have found it useful to take a snagit screen shot for learning library purposes but the chart seems to have grown recently and I can't see all of the chart at one time, any way you can get it back to a smaller size so I can see RSI, CCI, time etc all in one shot? Or is there some adjustments I can make to make it easier to see?
Thanks.

Sally
 
CM, look forward to seeing if your new toy works - 'cos the opening doodha is the thing that does me in every time !

cheers
 
Nice triangle brewing on Dow.... sitting over 100MA. 1 min.ES vol diminishing... last up move on RSI weak though....current ES 5 min bar good...and CCI bouncing off Zero.
 
Going nowhere and SR Swich on price...Third hit on 1024 on ES
I'l carry on with the knitting for now.
 
NB

Thanks for the alternative location for CM charts but I'm still running the old MS 95 Word version here, can't get into Word 2000 version where the charts are posted on this site - unless there is a kindly conversion in MS site, I can't access it?

Sorry to be a pain - is there a reason why charts can't be posted smaller on this site, I'm no techie, so I've no idea!

SallyT.
 
SallyT
If you scroll down there is a word viewer for you and also there is a version in pdf format.

The chart size is down to how the poster presents them and your screen resolution.

I have mine to 1024 768 and dont have many problems scrolling back and forth

HTH
Happy training
NB
 
Sally, I'll post them a little smaller. Check out the weekly review and you will find the "word for windows "viewer.
 
Did anyone get that spike just then on the 1 min chart, what was that all about?
 
Tom Hougaard's view on this:

"After the announcement at 19:15, watch out for 3 spikes, of which the first shows the true direction, after the second fake spike has ended. This 3-wave sequence has taken place on virtually every single FED meeting in recent time. The second wave is the fake wave."

How true....
 
The expanding triangle has a target of 9700 and the bull flag's target is 9750/60.

So far so good. :cheesy:
I'll just post an exception.... I didn't see the triangle on the dow, but it jumped out at me on ES. Rare one.... The big spike on the dow screwed it.
 

Attachments

  • triangle.gif
    triangle.gif
    57 KB · Views: 579
Nice double target hit. Now do we sit here and dither for a while? Squarely in last weeks congestion area and right on support/resistance line of 9750. Good RSI ratio, but little headroom so pullback time? CCI support break for a 10 min close?
 

Attachments

  • dow 28-10-03 10.gif
    dow 28-10-03 10.gif
    34.4 KB · Views: 554
What a bore waiting for the news....Still, for those that stayed the course and were long, it was another ton up.
Entry at 9632.Why? One because of the pullback to the magic 32. Two because the drop was weak on RSI ratio. Every once in a while, there is good reason to take an early trade. This was one of them. The next rise up was good on strength, but should have still been an out on the ND top. Hold or go, the go signal was the dbl bottom on support at 9650..and a long wait.... Those faint of heart, or common sense should have closed out before the news and taken the couple of points.
Didn't have to wait too long for the next one as the triangle broke... and another decent move, with the pullback to 9700 giving a target of 9740, tying in nicely with the 10 min calculations and a sweet pullback to 32 again into the close. Check out the RSI ratio on the pullback to 9700. You really didn't want to close there now did you?
 

Attachments

  • dow 28-10-03 1.gif
    dow 28-10-03 1.gif
    24.5 KB · Views: 527
CCI did break, followed by a swift recovery, heavily testing 9775. Back to test 9750?
 

Attachments

  • dow 29-10-03 10.gif
    dow 29-10-03 10.gif
    34.2 KB · Views: 483
Top