You are using an out of date browser. It may not display this or other websites correctly.
You should upgrade or use an alternative browser.
You should upgrade or use an alternative browser.
Dow Intraday charts 24/11 - 28/11
- Thread starter tradesmart
- Start date
- Watchers 6
tradesmart
Experienced member
- Messages
- 1,286
- Likes
- 22
Hi Lockstock.
As a 'beer-money' investor, I can confirm that I'll be on the ale tonite (if not sooner) thirsty work all this screen watching.....!!
Don't know about the 'triple', might have a double later
When I saw the index bounce off CM's 'magic 64' in the first 20 mins, I knew what to do......(surprisingly!)...... a smidge of PD to give another clue........
Must have been gripped by a fit of irrational pessimism when I nominated my Dow Comp entry this week - should have put a stop-loss on it!!!!!!!! :cheesy:
Regards
Attachments
Hi TS,
Just trying to decide where the INDU might be heading on Monday.
No real clues- looks like- go with the flow- I see D4F pushed it up 20 pts on the close- was very tempted to hold a short over the weekend, but couldn't see any reason too.
Anyways, back to the book.
Have a good weekend!!
Just trying to decide where the INDU might be heading on Monday.
No real clues- looks like- go with the flow- I see D4F pushed it up 20 pts on the close- was very tempted to hold a short over the weekend, but couldn't see any reason too.
Anyways, back to the book.
Have a good weekend!!
Attachments
Last edited:
tradesmart
Experienced member
- Messages
- 1,286
- Likes
- 22
LS - The SB's 'futures' price very often tracks the CBOT mini DJ Futures price chart and you can see the spike up from the bull flag after the market close today.......
I've successfully used the CBOT chart for placing pre-market trades as well..
Wouldn't like to guess Monday's scenario with the dollar in apparent freefall.. 😕
However, US market strategists comment:-
"When we get a full audience back on Monday, I think they will come back in a buying mood" 😆
I've successfully used the CBOT chart for placing pre-market trades as well..
Wouldn't like to guess Monday's scenario with the dollar in apparent freefall.. 😕
However, US market strategists comment:-
"When we get a full audience back on Monday, I think they will come back in a buying mood" 😆
Attachments
Last edited:
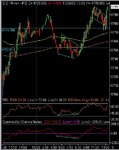
Here's something I've yet to figure out..... Think about RSI. We all know about divergences +/- and what it means. At some point, we can get a substantial move in one direction. Now, RSI cannot go indefinitely in that same direction, confirming the trade. So, it has to pull back. In doing so , there will /has to be an element of divergence. How do we distinguish between this divergence and a "rebasing" of the RSI level, ready for another push in the current direction?
We still have divergence in RSI on the 10 min chart. Will this result in a drop, or is RSI "rebasing", ready for a big push up?
We still have divergence in RSI on the 10 min chart. Will this result in a drop, or is RSI "rebasing", ready for a big push up?
Attachments
This short day was a real tortoise. The chart looks great, without the numbers by the side..... Going long on the DB 64 was a smart choice, with a clear stop just below for just a few points loss.The pullback to 75 confirmed the move up and gave some breating space- not that it was needed, just crawling along... No reason to get out until 9800 failed, making a lower high at 9802. That was confirmed by the RSI support failure a short while earlier. Good for 30 odd points, but not much else. Looks like a 100 point move, doesn't it? 🙁
Attachments
CM,
Evening
I look at how hard the RSI comes off in relation to the price movement, there is no way of knowing prior to any move(imho)
Some moves of the RSI take the Index with it, whilst other times the indicator re-adjusts for another push& the index remians fairly steadfast.
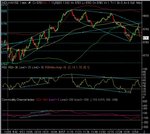
Just having a look at the weekly INDU- chart below has 100 ema in Black, 50-red & Blue EPma 10.
The last candle looks bullish, & the CCi has come off sufficiently to allow another go at 9900, adversly the blue 10EP ma has moved above the action, which hasn't happened since July
Evening
I look at how hard the RSI comes off in relation to the price movement, there is no way of knowing prior to any move(imho)
Some moves of the RSI take the Index with it, whilst other times the indicator re-adjusts for another push& the index remians fairly steadfast.
Just having a look at the weekly INDU- chart below has 100 ema in Black, 50-red & Blue EPma 10.
The last candle looks bullish, & the CCi has come off sufficiently to allow another go at 9900, adversly the blue 10EP ma has moved above the action, which hasn't happened since July
Attachments
Last edited:
I still look at the daily trendline spanning back a few months now, that were support for the dow, but over the last week or so prices are still trying to capture that support at the moment i see it as resistance, because all the other times the price has touched it from the upside and bounced up, but weve been below it trying to get back up, looks weak on that basis, its hugging the uptrendline, but from underneath, the longer weekly line, the price is just on it give or take a few .. plus the weak dollar against pound, euro, gold nudging 400 an ounce again... should be a week with some bigger ranges either way.
jd
jd
In my experience, the problem relates to the construction of
the RSI. An RSI has natural limits as to how much data it can
store and then carry forward to the next reaction to price
movement.
There is a discontinuity much akin to the problems with an SMA
which is presumably why you like the EMA.
The internal arithmetic of the RSI may provide a clue as to
whether the current move is just a pause for breath or something
else but I have not found it.
It is also why it is often better to wait for a higher low on RSI
rather than use the bottom as an entry key.
So the answer to your question may be found by examining a
different indicator. But I don't think that's what you want to do.
But if you ever find an answer, I would be very interested
(and millions of others too, I guess)
Morning
Found myself subconsiously thinking about this question whilst in slumber- came to the same conclusion as Bonsai.
Imho it's the parameters with the RSI that are a problem,( & there for as Bonsai states the way it is calculated) if the index goes on a romp the RSI has a ceiling & whilst there is no respite in the move North ( or South in a down move) in the particular instrument you are guaging. The RSI just continuopusly bumps up against the ceiling or grinds along on the basement.
Look for another indicator! Well the best one I've seen is Updata's market tracker- shame they're are a bunch of ignorant t055ers.