tradesmart
Experienced member
- Messages
- 1,286
- Likes
- 22
ChartMan has normally started the weekly thread by this time, so I hope that everything is ok with him…..
I’ll ‘push the boat out’ in his absence and hope that we’ll hear from him later..
I’ll also take the opportunity to thank him again for all his good work – I didn’t know much about T/A before starting to follow Dow Intraday charts, but it’s a trading system that really works and you can apply it to stocks/commodities/currencies etc as well as indices……and make a fortune if you're careful..... 😉
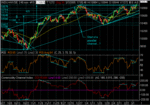
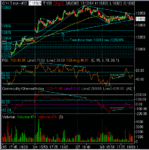
The daily chart is showing the breakout through 10875 resistance that happened last Friday, and I’ve labelled it a possible ‘magic’ breakout that I suspect will have upside potential to equal or exceed that of the previous magic breakout last November which saw a surge to the north of virtually 700 points.
The large triangle that has been formed since the October lows implies a long term target of 12100, and RSI and CCI are showing plenty of headroom for a serious upside move…..
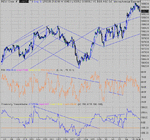
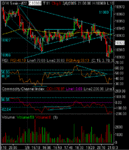
In the medium term the 4hr chart shows a potential target of 11300 referencing the 425 ish height of the consolidation formed between November and this month…..triangles breakout on RSI/CCI confirming the upside move..
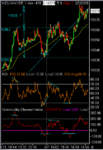
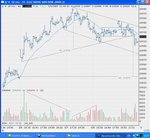
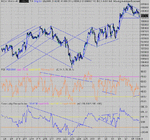
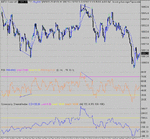
Today, I’m focusing on the inv H&S that has formed with the closing part of Fridays action on the 1min chart, which implies a target 11000 imho…
ECBOT has seized up just now, but I’m running a long position from 875 on Friday and just had time to close out two quick scalps for 20 points in the first 40 mins today…..
Ps – Good to see a bit of upside spark from the Naz today, which will help support the Dow imho….
Pps - ECBOT back online now, so in control.....( 😕 )
Attachments
Last edited:


