Dow Intraday charts 7/Mar - 11/Mar

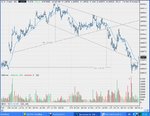
Re-testing 850 now from the underside. If it holds as new Resistance, I'll be short.

That'll be a chest of dubloons me hearty....
 
Yay gap fill at last!

Lovely 1-2-3 bottom too (only overshot my target by 13, not too bad :)), as long as this test of 840 holds. Not much sell volume yet so reckon it will, then up to 880? If not, 800.
 

Attachments

  • untitled.JPG
    untitled.JPG
    113.6 KB · Views: 218
Quite amazing when you think about it.

There's me looking at it as a test of potential Resistance at 850, and Fruggish seeing it as a potential test of Support at 840.

Both of us are going to be right and trade quite correctly within our own perception of what transpires. (Well, I am anyway.... :cool: )
 
I think you might have it this time Brembo :) Stop dumping all those contracts please, you're getting very close to my sto...aaargh!
 
That'll be a chest of dubloons me hearty....

Nice call Brambs…

It was that personal gap fill tuition that you received from Soeur Madeline (1-2-1, behind closed doors) that is behind your success…?!....Oui.....?

And I bet you don’t even fancy a large Benedictine any more….. ;)
 
tradesmart said:
Nice call Brambs…
Be even nicer if it tanks on down to 750, but might need to sit tight until the end of the week for that - if at all. I'll let the market decide that for me.


tradesmart said:
It was that personal gap fill tuition that you received from Soeur Madeline (1-2-1, behind closed doors) that is behind your success…?!....Oui.....?
Well, she was the best, bar nun. I'm not a total convert, but no longer feel the need to visit the Rue De Nuf.


tradesmart said:
And I bet you don’t even fancy a large Benedictine any more….. ;)
Suffice to say that my trading style has led me to enjoy the experience of swinging both ways when the opportunity presents itself.
 
It all went pear shaped on this SR line....at 920... Let's hope 780 holds...
 

Attachments

  • dow 09-03-05 10.gif
    dow 09-03-05 10.gif
    45.6 KB · Views: 234
Easy ride down off the Bump top/H&S, But how to find that exit? OS on CCI? I guess anywhere on the 832 line... but then the sting in the tail as it flew up to test 64,only to drop right into the close.
 

Attachments

  • dow 09-03-05 1.gif
    dow 09-03-05 1.gif
    30.9 KB · Views: 221

Attachments

  • 10-03-05.gif
    10-03-05.gif
    20.7 KB · Views: 195
tradesmart said:
Yesterday's flight from equities was attributed to a "spike in bond yields" - spikes often return to par - we'll see....

And some spike it was too ! +3.2% on the 10 year and +2.8% on the 30 year T notes. A few burned fingers there then.
 
Anyone trading YM - most of the volume has gone over to the June contract as of today (although the March contract is trading until the 17th)

A nod's as good as a wink to a blind horse..... ;)
 
ChartMan said:
It all went pear shaped on this SR line....at 920... Let's hope 780 holds...
Which it did - spectacularly. I didn't much like the volume either on that rebound and was out of my short like a flash on the next bar instead of waiting for my 805 stop to get hit.
 
780 held a treat and off we went... but will this develop into a broad H&S?
 

Attachments

  • dow 10-03-05 10.gif
    dow 10-03-05 10.gif
    42.4 KB · Views: 202
Good rise off O/S for a change.... not surprising this time as 780 was 'expected' support... Easy ride up to T1, where ther was double confirmation by way of the triangle and bull flag post breakout. Not so easy to get out at the top, but the loss of 64 should have prompted a quick exit. Room for more upside tomorrow, with the market gapping up post close...
 

Attachments

  • dow 10-03-05 1.gif
    dow 10-03-05 1.gif
    29.5 KB · Views: 242
The 60 min chart shows that the Dow is following a distinct uptrend channel since the 10400ish lows at the end of January with two major waves up so far, and with RSI/CCI at (relative) ‘lows’ we may be at the beginning of a third wave up to speculatively test the 11000 barrier….
 

Attachments

  • 11-03-05.gif
    11-03-05.gif
    34.9 KB · Views: 208
whatever happened to TraderTony?
I always looked forward to his daily trading log.
he appears not to have posted for a while.
 
TS,
I hope you dont mind a silly question.
Why do you use 60-min bars ?
since the trading day is from (out time) 2:30pm to 9:00pm, thats 6.5 hours.
Dont you get a "false bar" at the end of the day, as it can only cover 30 minutes.
Or is there some calculation to account for the final 30 mins?
 
TS,
I hope you dont mind a silly question.
Why do you use 60-min bars ?
since the trading day is from (out time) 2:30pm to 9:00pm, thats 6.5 hours.
Dont you get a "false bar" at the end of the day, as it can only cover 30 minutes.
Or is there some calculation to account for the final 30 mins?
trendie - it's a YM futures chart and you can trade futs pre and post market.....in fact virtually 24hrs...

I use charts in a variety of timeframes - they all have their useful perspectives...

whatever happened to TraderTony?
Probably taking some time out to spend his winnings..... ;)
 
Top