You are using an out of date browser. It may not display this or other websites correctly.
You should upgrade or use an alternative browser.
You should upgrade or use an alternative browser.
bonsai said:I have
10375 on 13th jan
10608 on 20th jan
I have 10370 on 13/1
10616 on 20/1
not much different but I wonder if someone else can confirm whose data is correct
James There is a difference between INDU and DJI..... one is theoretical one is actual . Don't worry which one you use, the odd few points difference will hardly matter.
Rustic I have used RSI strength from the 10 min chart to estimate the points move per point in RSI. It worked out at about 3. So given that there is room for RSI to move up 15-25 ( 80 - 90) I can estimate the likely points move up. All pure guess work, based on yesterday's momentum carrying on.
Rustic I have used RSI strength from the 10 min chart to estimate the points move per point in RSI. It worked out at about 3. So given that there is room for RSI to move up 15-25 ( 80 - 90) I can estimate the likely points move up. All pure guess work, based on yesterday's momentum carrying on.
tradesmart
Experienced member
- Messages
- 1,286
- Likes
- 22
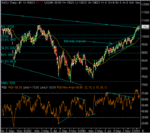
With the latest breakout to above 10600, everybody is still looking for a point where the bulls may pause for breath……
Around 10700 is the area where the rally post 9/11 stalled before pitching down to the 7200 low of October 02 – it is also the target of the recent 600 wide channel, when added to the 10100 breakpoint.
As stated previously, we are also in the area of the multi-year top trendline linking the highs of 2000 and 2001.
All of these factors may combine to create resistance (but will the bulls notice?!.................. 😕 )
Attachments
Also, divergence on RSI/Price - ok yesterday broke that pattern, but maybe that was a false breakout?
Combination of all those factors make me wary of going long at present.
Will short if it drops below 600 (multi year trendline) or if it goes up to 700 - jeez, somethings gotta break soon !
Combination of all those factors make me wary of going long at present.
Will short if it drops below 600 (multi year trendline) or if it goes up to 700 - jeez, somethings gotta break soon !
TheBramble
Legendary member
- Messages
- 8,394
- Likes
- 1,171
That would be my guess...but...
oh dear !
I have had my wrist slapped by Tradesmart in a PM for not
pointing out that he had posted about the 50% fib yesterday.
sorry, Tradesmart, I did check back on the posts but I missed yours.
although my post had more to do with a previous exchange with CM about the use of fibs.
I have had my wrist slapped by Tradesmart in a PM for not
pointing out that he had posted about the 50% fib yesterday.
sorry, Tradesmart, I did check back on the posts but I missed yours.
although my post had more to do with a previous exchange with CM about the use of fibs.
tradesmart
Experienced member
- Messages
- 1,286
- Likes
- 22
Well, Mr B - there are other keen fib spotters about you know! 😎
but thankyou very much for the confirmation as I said in my pm... :cheesy: (do you get many thankyou notes?)
short Dow 10645 (with the aid of fibs!) - I hope that the triangle delivers its target...
but thankyou very much for the confirmation as I said in my pm... :cheesy: (do you get many thankyou notes?)
short Dow 10645 (with the aid of fibs!) - I hope that the triangle delivers its target...
One Eyed Shark
Well-known member
- Messages
- 257
- Likes
- 13
Potential bottom ?
Div volume in ES
S&P and Nas sarting to pull off lows and printing H/L H/H & Dow has not given up as many points as the S & P in the drop.
Div volume in ES
S&P and Nas sarting to pull off lows and printing H/L H/H & Dow has not given up as many points as the S & P in the drop.
Similar threads
- Replies
- 74
- Views
- 13K
- Replies
- 2
- Views
- 2K
- Replies
- 194
- Views
- 25K

