Dow Intraday Charts 20 Jan - 23 Jan

Just a different view on the 10 min chart, maybe we are not quite ready for the bears yet.
 

Attachments

  • snapshot-2.jpg.png
    snapshot-2.jpg.png
    122.1 KB · Views: 394
Interesting view..... never considered that.... there are 3 slope changes on support. I've only ever noticed this on an intraday tanking to help find the bottom. Could we be heading for a 4th change, to go sideways????
 
Well the divergence and the RS switch are working a treat now CM - 10560 on the cards? I'll look forward to seeing your trendline arrangement for today......

I've drawn lines in to reflect todays action - it looks quite bullish now, but we normally have 3-touches on the lower support line before it breaks out?! - suggests it might head south again later...... :confused:

I'll be delighted if it doesn't...(thinking about my Dow Comp entry for this week :cheesy: )

ps - nice chart OES - food for thought - this is going to see 10700 before long imho

pps - any ideas on targets for today? - I'm thinking 10570-10580 assuming we get a channel breakout, or is this far too optimistic?!
 

Attachments

  • 21-01-04.gif
    21-01-04.gif
    15.2 KB · Views: 386
Last edited:
We're were bang on down channel resistance at 545. I'm with you, but no spikes and parallel lines, as I drew last night.
 
does that resemble a buy programme or something. never seen dow pop up so fast at this time of the day?
 
Dont know about program buying but certainly controlled by
the big boys look at the time..just befor UKX and zh4 closure. Very
clever imo.
 

Attachments

  • screenshot052.gif
    screenshot052.gif
    16.7 KB · Views: 351
fazalv, I've recently become a keen wave counter myself; and counting 5's certainly worked to predict the short-term bottom on the Dow 10min chart yesterday, and has worked on the Nasdaq Comp 10 min chart today, but how it works in longer time frames I don't know......is there an expert in the house who can advise us on this?

just closed long at 10578 - an unexpectedly large bite of the apple?! - so much for the earlier "whipsaw" talk.... ;)....now see it 'whip' up to 10600..... :confused:
 
I see that the March Futs have spiked up to 10591 (10611 cash equivalent) possibly a 'rogue' trade - bet that took out a few short stops!?

I've seen spikes south bigger than that - underlines the importance of a tight stop-loss imho :eek:
 
YM spike will have been very painful for some. (Could have been me but fortunately wasn't!) It just shows that the Dow futures are stuill very illiquid. The spike was on volume of only 1491 contracts at $5 ppoint (on 1min candle). Therefore, I think as a chart signal irrelevant?

What is developing now? Classic bull flag? I see RSI and CCi moving steadily from overbought to cheap?

Another 40-45pt rally targetting 625?
 
BG - now that the Dow cash is making a double-top with the highs reached at the open yesterday I'm watching to see which way it breaks.....things have become very bullish again and I'm not jumping to conclusions......

"The market continues to hold up pretty well," said Todd Clark, head of listed equity trading at Wells Fargo Securities. "This morning we had a little bit of a 'sell on the news' reaction, notably with Merrill Lynch and some of the technology stocks."

"But these type of pullbacks are short lived and actually part of a healthy consolidation. It seems to me the market wants to trade higher."

edit 20.43 - at least we know where support is now - 10600!!! - how things change!!!!!!! :LOL:
 
Last edited:
Must admit don`t see the YM as having spiked much more than the ES, overshot by about 10 points that`s all.
Look at it this way wouldn`t have bin painful at all if you were long from the ES`s bounce on support or it`s pivot :D
 
You can see TS's interpretation of the DC trend line v mine from last night. I've said before you don't need to be too critical, so long as your general direction is correct. At the break of each line, there is only 20 points in it. As usual, we know that a break of the channel lines leads to a fairly big move. Bit of an understatement tonight. Excellent observation by Hooya too on the action when the other markets were due to close....
So, given that we move between paths of least resistance or "status quo", then I suggest we are back into the previous up channel. Not a lot of room for up with RSI at 65, but the recent peak at 90 allows us between 15x3 and 25x3points = 45-75 which could take us to channel top..... I guess we need to see how the overnight market performs.
As a final point, if we take this as a dog leg "W",the target is 700. IF RSI goes to max,then we have 622 + 75 = 697. I daren't say my money is on700 :(
 

Attachments

  • dow 21-01-04 10.gif
    dow 21-01-04 10.gif
    30.4 KB · Views: 374
Bad move going to the Pub, Mom. :(
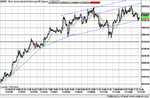
A perfect day for the TA guys. :cheesy: The omens were good right from the off with a PD bottom coming good , stretched over from yesterday. Remember, you can only count on that when there is no overnight market gap.... That was followed by an RS Switch, that I wasn't sure about,after yesterday's bad call, but it was spot on.... From there on it was plain sailing right to the top at T4, 640, just jumping from T1 to T2, from T2 to T3 and so on. T2 entered the lunch break, but no cause for concern, being kept up by the 64. You could have been excused for getting out at 639, missing the target by one point.... The proper out was the third peak, what a surprise. If you had any energy left, you could have taken a short gamble.... a safe bet for once, maybe. I'd say that was close enough to call it a close at HOD and ES futs. right now are back to close on HOD.
Could be another good day tomorrow. The last time I saw a perfect staircase rise up must have been 18 months ago....
I've posted two 1 min charts as there is a lot to fit on one chart.
 

Attachments

  • dow 21-01-04 1.gif
    dow 21-01-04 1.gif
    25.7 KB · Views: 371
Chartman
nobody seems to have commented on it but perfect example
today of 50% fib.?

even if you don't trade fibs, its worth putting them on your charts ?
I only use 38/50/62.
 

Attachments

  • dowfib.gif
    dowfib.gif
    12.2 KB · Views: 359
I will have to pass on the 23. only use the ones I mentioned as
when they are in play, they have the promise of the end of
something and therefore substantial profit potential.
 
Top