You are using an out of date browser. It may not display this or other websites correctly.
You should upgrade or use an alternative browser.
You should upgrade or use an alternative browser.
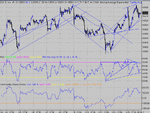
This is a messy state of affairs, vol is screwed, TA is screwed so you have to fly by the seat of your pants for a while till it settles down. I'm not saying that this cannot be a divergent top, just that it hasn't performed as one would expect. If it's not clear cut, don't bank or gamble.....
How right you were, Anmo. Has anyone spotted the double ND? Most unusual. Iv'e seen four consecutive peaks on ND ( and more on PD) but not like this.... A first ND that doesn't tank, continues on to close at , or near HOD. Interesting times....
Take care on 10 min chart divergences. Usually, they develop over two or three days before they deliver..... What you are seeing is more likely to have been a 1 off. Unfortunately, one will only get to know this by experience, and that takes a lot of time. There is nothing wrong with your observation, as such. It is factually correct. In conjunction with other clues, it can be used as a secondary or alternate confirmation of some other reason for thinking the price will turn round. For example, there is a trend line that goes through 510, 546 and 593. Of course, at the time, you can't possibly know that the extension of this line from 510 and 456 will have any significance. It is the same with the anticipation or expectation of 3 pk divergences. One cannot possibly say whether or not it will happen. All you can do is make a best guess as to the time, and likely price of the third peak. IF those two occur within your expectation, then it is probable that the divergence is valid. Outside of that, all you can say is that it probably isn't. Today has been particularly unpredictable in respect to seeing TA patterns that will deliver.
Just a quick reminder here, that when you see or get a confirmed 3 pk divergence, it does not mean a reversal in the price. It only means that the current move is all but done.
Just a quick reminder here, that when you see or get a confirmed 3 pk divergence, it does not mean a reversal in the price. It only means that the current move is all but done.
Not what I had anticipated from RSI. With the divergence, pointed out by Anmo on the 10 min chart, and the double top, we could be heading for a drop. The contrarian view is that the opening peak is noise, and could be discounted. If that is the case, then we should look for channel support . RSI will support a move to channel resistance.
Attachments
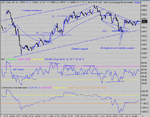
No divergence on the open drop left the only clue to the bottom being channel support and the rise and pullback to form the RS switch as confirmation. I pointed out earlier the slope change in the price support, indicating the potential long, just too late for Mom...sorry. At one point , it looked like the move would not continue, with the real possibility of a pullback the the 100MA before taking off. It didn't happen. instead, choosing to find support at 522 from the earlier pause point on the open drop. The potential for an ND top from 532 to 500 was commented on, but was nullified by the drop to 522. One could be forgiven for taking the following ND top across 32 minutes. The trick now would be to not get drawn into a short.... It's always easy to jump in feet first... But there should never be a rush to take a position.... It's easy to say, especially with hindsight, but this is a time for careful consideration, the same as at the bottom on the open....Close, and re- consider. If you feel the urge to jump in, take a smaller stake...you can always add to a winner on a pullback to move you back up to your normal stake size. Sitting on a wrong trade will often lead you down the path of irrationality...
The last divergence had it all going for it. 3 pk PD, channel support, and 32 bounce. A rare chance to take a stop and reverse. The safe long entry was at 540, with an expectation of a close to wards HOD. It didn't workout, and probably ended at best as break evens.
The last divergence had it all going for it. 3 pk PD, channel support, and 32 bounce. A rare chance to take a stop and reverse. The safe long entry was at 540, with an expectation of a close to wards HOD. It didn't workout, and probably ended at best as break evens.
Attachments
so much potental for points today and so little gained - in my case anyway - once again after a good start I let it go - patience and the desire not to lose is my biggest problem.
2 big mistakes :
1 - Closing on 100 EMA after intial drop - 100 odd points became 35 points.
2 - Long of the V bottom and close 'cos I thought it had failed and wanted to close a few points in profit - should have stuck to my stoploss at 470. Another 100 points turned into 2.
And that's not mentioning the other mistakes.
Ah well, shorted again at the top and followed it down this time. Must remember that trick 🙂
I think my abiding fear is that despite getting the TA right, I just can't help thinking that it's gonna go against me and bite m on the butt - that's why I keep closing for a few points. If I was more confident, I wouldn't be so trigger happy with the stocks.
It'll come in time - better do !
tradesmart
Experienced member
- Messages
- 1,286
- Likes
- 22
It looks like there could be another test of 10600 today – GE & JNPR have posted solid earnings and outlooks, and with the likelihood of +ve data at 13.30, the futures are nudging 600 right now
But 10600 coincides with the major multi-year trendline linking the highs of 2000 & 2001, so could be a stern test for the bulls to make a clean breakthrough….. 😕
BTW- good luck to Dow Comp participants whose entries end in 564 (no leaderboard for most of the week, so no hint of collusion here!! :cheesy: )
Ample proof that there is some consistency among traders (but rare!)
Attachments
Similar threads
- Replies
- 74
- Views
- 13K
- Replies
- 0
- Views
- 2K
- Replies
- 10
- Views
- 6K


